
released: Feb 8, 2020 v2.0
There are (2) series of annual charts: Aspen and Snowmass Village CO
ASPEN REAL ESTATE 2008 – 2019
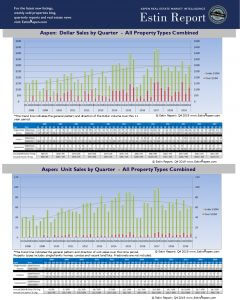
Aspen Historic Sales by year 2008 – 2019 (4 pgs)
Click on the chart above or link to open Estin Report: Aspen Real Estate Historic Quarterly Performance Sales Chart Series
Q1 2008 – Q4 2019 (4-Page PDF) for the following individual charts for Aspen CO:
– Aspen Total Dollar Sales
– Aspen Total Unit Sales
– Aspen Single Family Home Sales
– Aspen Condo/Townhome/Duplex Sales
– Aspen Vacant Land Sales
SNOWMASS VILLAGE REAL ESTATE 2008 – 2019
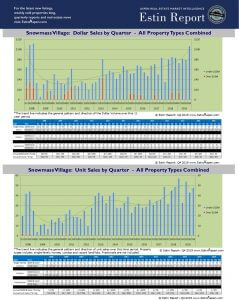
Snowmass Village Historic Sales by year 2008 -2019 (4 pgs)
Click on the chart below or link to open Estin Report: Snowmass Village Real Estate Historic Quarterly Performance Sales Chart Series
Q3 2008 – Q4 2019 (4-Page PDF) for the following individual charts for Snowmass Village CO:
– Snowmass Village Total Dollar Sales
– Snowmass Village Total Unit Sales
– Snowmass Village Single Family Home Sales
– Snowmass Village/Townhome/Duplex Sales
– Snowmass Village Vacant Land Sales
