

released 01/10/20 in the Charts Section
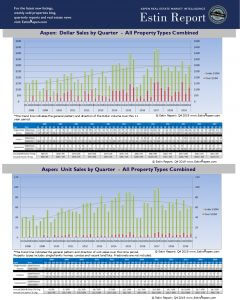
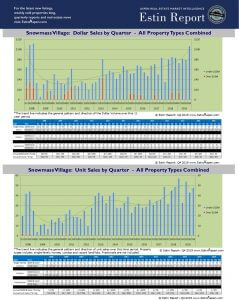
Estin Report Q1 2008 – Q4 2019: Aspen & Snowmass Historic Real Estate Performance Charts by Property Types and Dollar & Unit Sales Clients often ask, where’s the market now? These charts offer a succinct view and the conversation should be followed by a more substantive and detailed discussion especially with regard to neighborhood specifics. Not all neighborhoods are equal … each with their own unique attributes and qualifications.
