

Released Mar 5, 2018 v2.21. (Updated footnote for “February 2018 Aspen and Snowmass Average Sold Prices Chart top of pg 3 to v2.22 on Mar 17, 18. No data changed.)
Yodel for the Mountains! Estin Report: Feb 2018 Aspen Real Estate Market
The Estin Report: Feb 2018 Market Snapshot Aspen Snowmass Real Estate is a 10-Page statistical breakdown of monthly and year-to-date sales in detail. The Monthly Snapshots are posted on or near the 1st Monday of the month. It is the only monthly Aspen market report to be published in a consistent and timely manner.
Yodel from the Mountains of Aspen – where the winter snows of mid-to-late Feb finally arrived giving us superb powder skiing after a dispiriting Dec – Jan drought, where the real estate market is super active and where everyone wonders how long this nice ride will continue.
With many economic metrics in record territory, prognosticators on the national level say we may have two years left (Dr Elliot Eisenberg at an Aspen Realtor Lunch on 2/22/18. See presentation.) – fueling it are tax cuts, increased government spending, still low interest rates, low unemployment, stable GDP, growing world economies and a record stock market. There is consensus that we are in uncharted waters across the board.
In Aspen, our present up-cycle is now 8 years old, the 2nd longest on record since 1976, according to Randy Gold of Aspen Appraisal Group. The recent Feb. 2018 stock market correction was déjà vu all over with early 2016 when the Dow tanked due to plummeting oil prices and hyper worries of a China slowdown. That event triggered the severe 9-month election year fall-off in the local real estate market up to Nov. 2016.
Since then, our market has recovered to near record 2015 levels. Activity has been largely fueled by high demand for Aspen real estate inside the roundabout – which proved itself highly resilient and liquid during the Great Recession – and that focus continues unabated today. But also, at long last, smart buyers are recognizing and snapping up the far superior values outside the roundabout.
In general, optimism rules even though there are any number of macro events that could spoil the day – Korea, the budget deficit, national debt and other factors unknown.
Bottom Line Feb 2018
Sales activity for the year through Feb 2018 is up 30-35% over the same last year.
Specifics:
1) Under contracts (UC) for the month of Feb are up 107%, (56) this year vs (27) last year – UC’s are used as an indicator of future activity.
2) Aspen condos sales are on a tear and under price pressure as inventory of listings for sale is down 33% over last year—demand is far exceeding supply.
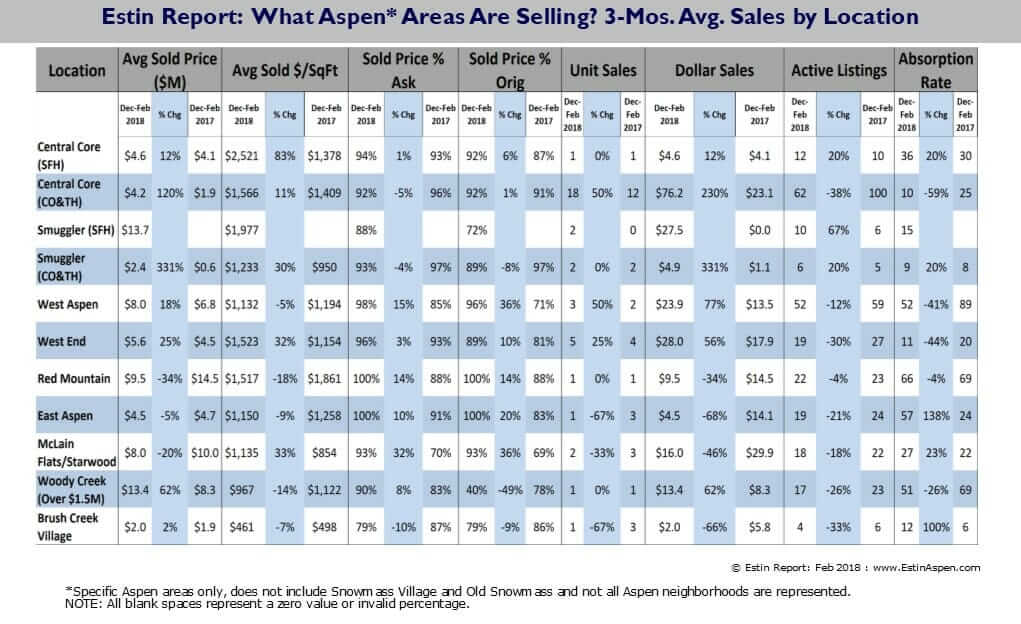
3) Sales are taking off outside the Aspen roundabout:
–McLain Flats, Starwood and Woody Creek are seeing significant uptick in sales. Compared to inside the roundabout, there’s obvious value and greater selection here.
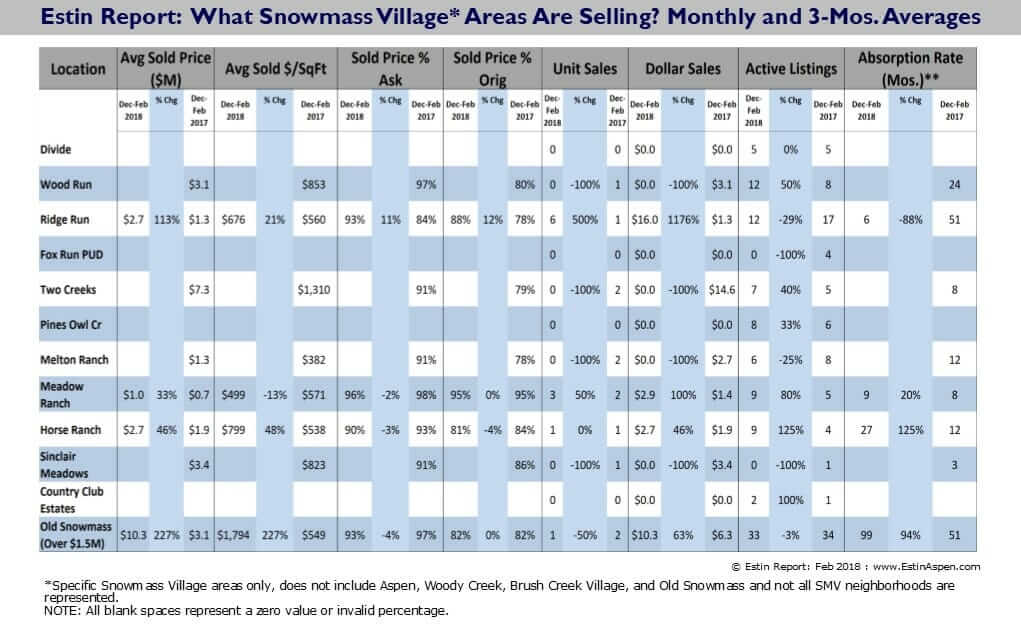
–Old Snowmass is finally coming out of the cold with (2) notable sales at the end of Feb and (4) properties priced over $2M presently under contract – a huge leap in activity.
4) Snowmass Village sales activity is up as the new Base Village moves beyond construction phase to more visible completion, and the 40-50% price discount-to-Aspen attracts ski-in/ski-out buyers and value seekers.
5) Sales are expanding geographically throughout the upper Roaring Fork Valley, in general, as is to expected in a maturing market cycle.
Feb 2018 Aspen Real Estate Market
(For complete 10 Pg Report go to download link on the upper right)
Deep Dive: Sales by Neighborhoods:
Aspen Neighborhood Sales Pg 7 Snowmass Village Neighborhood Sales Pg 9
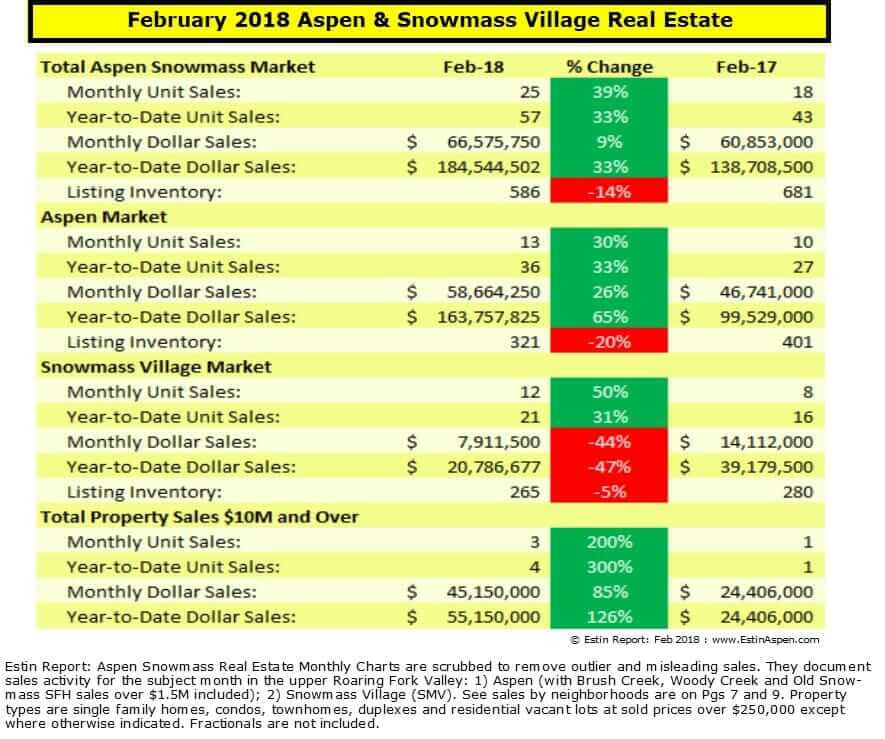
February 2018 Market Statistics Summary for Aspen Only *
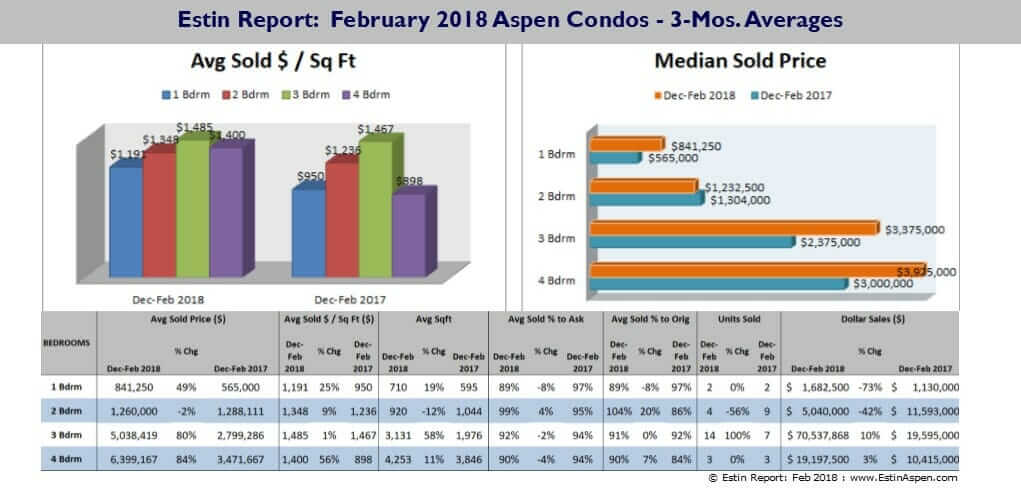
Aspen condo sales February 2018
- Unit Sales: 50% (9) in February ‘18 from (6) in February ‘17
- Dollar Sales: +29% $17M in February ‘18 from $13M in February ‘17
- Inventory Active Listings: -34% (118) in February ‘18 from (179) in February ‘17
Aspen condo sales Year-to-Date (YTD)
- Unit Sales: 53% (23) in February ‘18 from (15) in February ‘17
- Dollar Sales: +137% $84M in February ‘18 from $35M in February ‘17
- Inventory Active Listings: -30% (121) in February ‘18 from (173) in February ‘17
Aspen Single family home sales February 2018
- Unit Sales: 33% (4) in February ‘18 from (3) in February ‘17
- Dollar Sales: 46% $41M in February ‘18 from $28M in February ‘17
- Inventory Active Listings: -8% (157) in February ‘18 from (171) in February ‘17
Aspen Single family home sales YTD
- Unit Sales: 50% (12) in February ‘18 from (8) in February ‘17
- Dollar Sales: 48% $77M in February ‘18 from $52M in February ‘17
- Inventory Active Listings: -8% (162) in February ‘18 from (176) in February ‘17
* Typically, the Aspen market represents 70-75% of the total combined Aspen Snowmass Village real estate marketplace.
Links to February 2018 Aspen and Snowmass Village Sold Property Photos and Details
Aspen Feb 2018 Closed Properties (13). This link is valid until 4/1/2018.
Snowmass Village Feb 2018 Closed Properties (12). This link is valid until 4/1/2018.
_____________________________________________
