

Released Sept 12, 2019 v1.75. The Estin Report publishes 10-page monthly Aspen real estate market “Snapshot” reports as PDF file on or near the 1st Monday of each month. The Snapshot presents a “bottom line” summary and raw data for the subject month and YTD performance for residential real estate sales in Aspen and Snowmass by overall market(s), 6-mos avgs. sales for different property type and by neighborhood. There are three sections:1) Total combined Aspen Snowmass Village Market; 2) The Aspen Market; 3) The Snowmass Village Market. It features charts, tables and 30-day live links to photos and details of sold properties and compares the subject month to the same time in prior years. The Monthly Snapshot is the only Aspen and Snowmass property sales information widely published in a timely and consistent manner early each month.
Click images to enlarge.
Download 10-Pg PDF to the right
Click images to enlarge
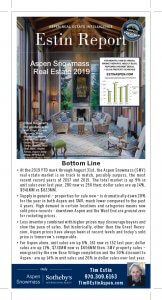
Bottom Line
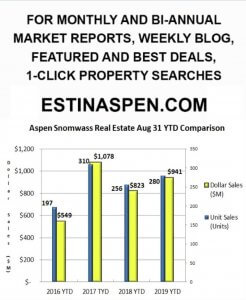
At the 2019 YTD mark through August 31st, the Aspen Snowmass real estate market is on track to match, possibly surpass, the most recent record years of 2017 and 2015.
Supply in general – properties for sale now – is dramatically down 20% for the year, significantly lower compared to the past 4 years and demand is high. This creates upward price pressure producing new sold price records in certain locations and categories. Downtown Aspen and the West End are ground zero for rocketing prices.
Less inventory combined with higher prices may discourage prospective buyers, slowing the overall pace of sale, but historically other than the Great Recession period, Aspen prices have always been at record levels and today’s price is tomorrow’s comparable.
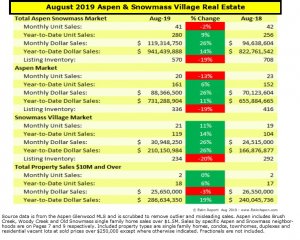
The overall performance of the combined Aspen Snowmass real estate market is up 9% in unit sales over last year, 280 now vs 256 same time 2018; dollar sales are up 14%, $941MM vs $823MM.
For Aspen alone, unit sales are up 6%, 161 now vs 152 then; dollar sales are up 11%, $731MM now vs $656MM then. Most importantly, listing inventory is down 19%, 336 now vs 416 same time last year.
Snowmass Village property sales – energized by the new Base Village completion and the half price discount to Aspen – are up 14% in unit sales and up 26% in dollar sales over last year.
August 2019 Market Statistics Summary for Aspen Only *
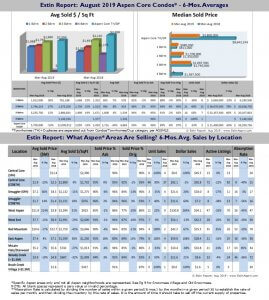
Aspen condo sales August 2019
- Unit Sales: +11% (10) in Aug ‘19 from (9) in Aug ‘18
- Dollar Sales: +27% $21M in Aug ‘19 from $16M in Aug ‘18
- Inventory Active Listings: -28% (117) in Aug ‘19 from (163) in Aug ‘18
Aspen condo sales YTD
- Unit Sales: +10% (90) in Aug ‘19 from (82) in Aug ‘18
- Dollar Sales: -14% $197M in Aug ‘19 from $228M in Aug ‘18
- Inventory Active Listings: -7% (242) in Aug ‘19 from (261) in Aug ‘18
Aspen Single family home sales August 2019
- Unit Sales: +29% (9) in Aug ‘19 from (7) in Aug ‘18
- Dollar Sales: +93% $67M in Aug ‘19 from $35M in Aug ‘18
- Inventory Active Listings: -12% (173) in Aug ‘19 from (197) in Aug ‘18
Aspen Single family home sales YTD
- Unit Sales: -11% (51) in Aug ‘19 from (57) in Aug ‘18
- Dollar Sales: +17% $442M in Aug ‘19 from $376M in Aug ‘18
- Inventory Active Listings: -8% (264) in Aug ‘19 from (289) in Aug ‘18
Notes:
*Typically, the Aspen market represents 70-75% of the total combined Aspen Snowmass Village real estate marketplace. Active Inventory Aug 2019 is all the actives in August 2019; active inventory YTD is all actives through August of 2019 (Jan 2019 – Aug 2019).
Aug 2019 Outlier Sales:
> Old Snowmass: MLS 158822. 28 River Bend, closed $744,000/$582 sf was counted as Old Snowmass neighborhood sale Pg 7 and included in Aspen dollar volume and unit sales.
> Woody Crk: MLS 148750. 6067 WC Rd closed $6.05MM/$828 sf was counted as Woody Cr neighborhood sale Pg 7 and included in Aspen dollar volume and unit sales.
August 2019 Market Statistics Summary for Snowmass Village Only
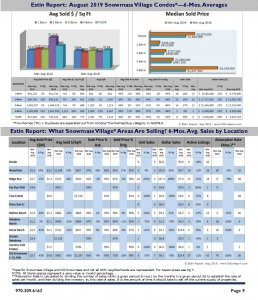
Snowmass Village condo sales August 2019
- Unit Sales: 0% (16) in Aug ‘19 from (16) in Aug ‘18
- Dollar Sales: +30% $15M in Aug ‘19 from $11M in Aug ‘18
- Inventory Active Listings: -17% (152) in Aug ‘19 from (184) in Aug ‘18
Snowmass Village condo sales YTD
- Unit Sales: +16% (85) in Aug ‘19 from (73) in Aug ‘18
- Dollar Sales: +47% $87M in Aug ‘19 from $59M in Aug ‘18
- Inventory Active Listings: -5% (290) in Aug ‘19 from (307) in Aug ‘18
Snowmass Village Single family home sales August 2019
- Unit Sales: +150% (5) in Aug ‘19 from (2) in Aug ‘18
- Dollar Sales: +40% $16M in Aug ‘19 from $12M in Aug ‘18
- Inventory Active Listings: -26% (71) in Aug ‘19 from (96) in Aug ‘18
Snowmass Village Single family home sales YTD
- Unit Sales: +14% (32) in Aug ‘19 from (28) in Aug ‘18
- Dollar Sales: +34% $121M in Aug ‘19 from $90M in Aug ‘18
- Inventory Active Listings: -4% (135) in Aug ‘19 from (141) in Aug ‘18
Notes:
* Typically, the Snowmass Village market represents 25-30% of the total combined Aspen Snowmass Village real estate marketplace.
Active Inventory Aug 2019 is all the actives in August 2019. Active inventory YTD is all actives through August of 2019 (Jan 2019 – Aug 2019).
Links to August 2019 Aspen and Snowmass Village Sold Property Photos and Details
Aspen Aug 2019 Closed Properties (19). This link is valid until 9/28/2019.
Snowmass Village August 2019 Closed Properties (21). This link is valid until 9/28/2019
Vacant Lots August 19 Closed Properties (1). This link is valid until 9/28/2019.
___________________________
