

Released Oct 7, 2020 v1.6 (The only change from v1.5 is in my bottom line comments last sentence which now reads, “While more anecdotal than fact at present, it appears that new listings coming onto the market in Aug and Sept are priced on average 15-30% above Mar-Jun 20 comparables and the pre-Covid quarantine period – I call it the “Covid 19 premium”. (v1.5 had the price increase, Covid premium, at 20-30%)
Bottom Line Sep 2020: Until you actually see the numbers, all the talk about Aspen experiencing a pandemic real estate ‘gold rush’ in July, August & September 2020 seems wildly exaggerated and hyperbolic. Until it isn’t…
The metrics are dizzying. A sampling:
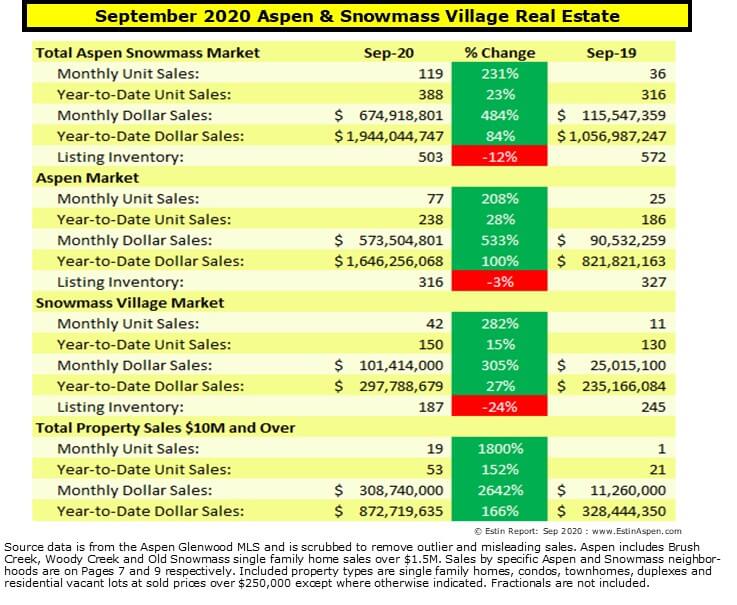
>YTD Jan 1- Sep 30, the total combined Aspen Snowmass real estate market is up 82% over last year, $1.93B vs $1.06B and unit sales are up 21%, 382 vs 316 (Pg 5).
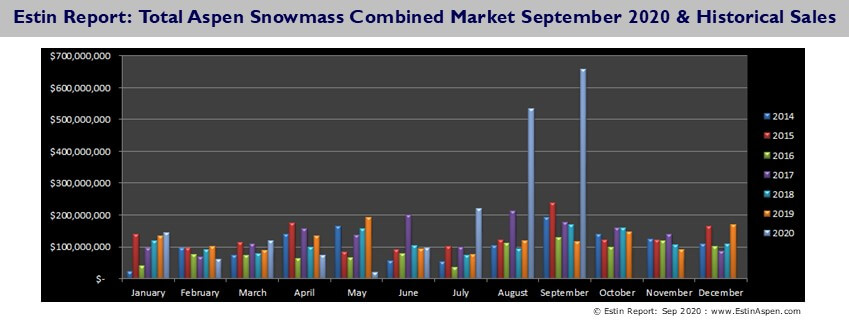
>Sep 20 total combined Aspen & Snowmass unit sales are up 231% over Sep 19; Dollar sales up 484%…There were (19) property sales over $10M in Sep 20 vs (1) in Sep 19, up 1800%. YTD, there have been (53) sales of properties over $10M vs (21) last year, up 152%.
>Future indicator: In Sep 20 there were (35) Aspen properties that went under contract/pending vs (17) in Sep 19, +106% – most of these pending sales will close in Oct & Nov 20; in Snowmass, there were (42) under contracts in Sep 20 vs (16) same time last year, up 163%.
>Listing inventory of properties for sale continues to fall to its lowest level in the past 10 years (Pgs 6 & 8).
>While more anecdotal than fact at present, it appears that new listings coming onto the market in Aug and Sept are priced on average 15-30% above Mar-Jun 20 comparables and the pre-Covid 19 quarantine period – call it the “Covid premium”.
>For examples of Before/After property sales activity, see Estin Report/Flip Jobs
High end purchases:
In the 3rd quarter 2020. (Jul 1,20 -Sep 30,20) There were $629M in sales of properties priced over $10M each in Q3 2020, or 71% out of a total dollar sales of $885M for the quarter …This compares to same time last year, when there were $67M in sales of properties priced over $10M each in Q3 2019, or 29% of the total $235M total Q3 2019 Aspen dollar sales.
Dollar sales in Q3 2020 were almost 10x more than same period last year.
Reasons for Aspen area spike in sales:
Covid 19 related, people exiting big cities – LA, NYC, Chicago, Miami, Dallas – pandemic, fires, urban unrest, health concerns, desire for better quality of life, global warming, historic low mortgage interest rates and search for cooler climates, mountain living at its best.
The pandemic sales surge is the result of buyers looking for more full-time living vs vacation home properties, larger homes to accommodate more family members, more space and open air. Anything new or like-new remodeled is flying off the shelf. If it is not, something is wrong or missing with the property.
Other less immediate reasons: Aspen offers a world class nexus of sports, arts, and culture unmatched in any other mountain community. We have amongst the strictest zoning rules in the country, extremely low property taxes, a sophisticated and technologically efficient valley-wide public transportation system and an advanced, 40 year affordable housing program for locals without peer from the rest of the country.
Aspen single family home prices
In Sept 2020, the median Aspen single family home price was $12M vs $6.475M in Sep 19, + 90%. This highlights the recent predominance of over $10M property sales in the market.
Aspen single family home average price per sq ft in Sept 2020
Aspen single family homes avg. price per sq ft was $2,028 sf in Sep 20 vs $1,249 sf in Sep 19, +62%. This increase can largely be attributed to newer built homes selling extremely well at record prices.
Aspen condos prices in Sept 2020
The 6-mos (Apr-Sep) median Aspen condo price was $3.44M vs $2.95M in Sep 19, +67% (Pg 7)
The average Aspen condo costs $1,803 sq ft in Sep 20 vs $1,681 sq ft in Sep 19, +7%.
Aspen 2-bdrm condo in downtown core in Sept 2020
Median downtown 2 bdrm condo costs $2.056M vs $.1.7M in Sep 2019, +21%.
The 6-mos avg price per sq ft for a 2-Bdrm Core condo is $1,967 versus $1,725 sq ft in Sep 2019, +14%.
While condo sales have been strong, they have been restrained due to a lack of inventory. If you are contemplating selling your property, now is the time to list – low inventory, record demand.
Links:
Q3 2020 Charts: Aspen and Snowmass Village – Dollar and unit sales by quarter since 2009 by area and property type
Sept 2020 Aspen & Snowmass Village Market Report Snapshot
Estin Report: Sep 2020 YTD Aspen Snowmass Real Estate Monthly Snapshot Historical Sales Market Report (pg5)
Aspen Only: September 2020 Market Statistics Summary
Aspen condo sales September 2020
Unit Sales: +106% (35) in Sep ‘20 from (17) in Sep ‘19
Dollar Sales: +233% $141M in Sep ‘20 from $42M in Sep ‘19
Inventory Active Listings: +19% (135) in Sep ‘20 from (113) in Sep ‘19
Aspen condo sales YTD
Unit Sales: +7% (115) in Sep ‘20 from (107) in Sep ‘19
Dollar Sales: +87% $447M in Sep ‘20 from $239M in Sep ‘19
Inventory Active Listings: +17% (304) in Sep ‘20 from (258) in Sep ‘19
Aspen Single family home sales September 2020
Unit Sales: +540% (32) in Sep ‘20 from (5) in Sep ‘19
Dollar Sales: +1075% $396M in Sep ‘20 from $34M in Sep ‘19
Inventory Active Listings: -10% (151) in Sep ‘20 from (168) in Sep ‘19
Aspen Single family home sales YTD
Unit Sales: +89% (106) in Sep ‘20 from (56) in Sep ‘19
Dollar Sales: +135% $1,120M in Sep ‘20 from $476M in Sep ‘19
Inventory Active Listings: +17% (326) in Sep ‘20 from (277) in Sep ‘19
*Typically, the Aspen market represents 70-75% of the total combined Aspen Snowmass Village real estate marketplace. The following Aspen Sep 2020 sales are considered outliers. They have been counted in total dollar and unit sales but are not included in the average price $/sq ft metrics within this report.
Outliers:
Aspen Mobile Homes: 164895, 165131
Aspen Teardown Home Sales to be counted as Vacant Land Sales: 154999, 160349, 154819, 161754, 164444
Aspen—Brush Creek Home Sales: 164768, 164981
Snowmass Village Only: September 2020 Market Statistics Summary
Snowmass Village condo sales September 2020
Unit Sales: +250% (28) in Sep ‘20 from (8) in Sep ‘19
Dollar Sales: +429% $44M in Sep ‘20 from $8M in Sep ‘19
Inventory Active Listings: -19% (132) in Sep ‘20 from (162) in Sep ‘19
Snowmass Village condo sales YTD
Unit Sales: +15% (107) in Sep ‘20 from (93) in Sep ‘19
Dollar Sales: +54% $146M in Sep ‘20 from $95M in Sep ‘19
Inventory Active Listings: -1% (304) in Sep ‘20 from (310) in Sep ‘19
Snowmass Village Single family home sales September 2020
Unit Sales: +600% (14) in Sep ‘20 from (2) in Sep ‘19
Dollar Sales: +279% $58M in Sep ‘20 from $15M in Sep ‘19
Inventory Active Listings: -32% (50) in Sep ‘20 from (73) in Sep ‘19
Snowmass Village Single family home sales YTD
Unit Sales: +18% (40) in Sep ‘20 from (34) in Sep ‘19
Dollar Sales: +6% $145M in Sep ‘20 from $137M in Sep ‘19
Inventory Active Listings: -5% (132) in Sep ‘20 from (140) in Sep ‘19
* Typically, the Snowmass Village market represents 25-30% of the total combined Aspen Snowmass Village real estate marketplace.. The following Snowmass Village Sep 2020 sales are considered outliers. They have been counted in total dollar and unit sales but are not included in average price $/sq ft metrics within this report.
Outliers: Stonebridge studio condos: 166294, 144141
Links to Sep 2020 Aspen and Snowmass Village Sold Property Photos and Details
Aspen Sep 2020 Closed Properties. This link is valid until 10/31/2020.
Snowmass Village Sep 2020 Closed Properties. This link is valid until 10/31/2020.
Vacant Lots Sep 2020 Closed Properties. This link is valid until 10/31/2020.
____________________________________
