

Released 03/06/16 v2.0
Feb 2017 Aspen and Snowmass
Real Estate Snapshot
(Click Table above for full 10 Pg PDF
with detailed charts and tables)
Bottom Line
Total Aspen Snowmass Village Real Estate sCombined
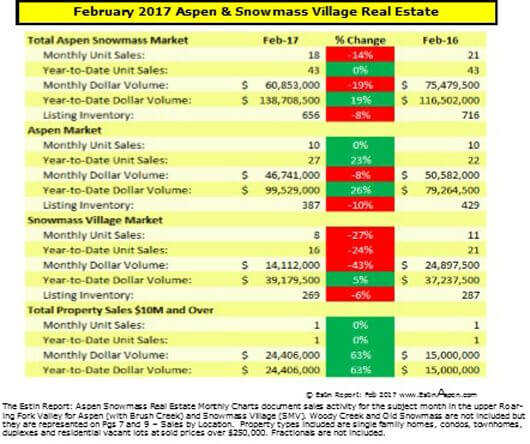
For year-to-date (YTD), Jan 1 through Feb 28, 2017, the total combined Aspen Snowmass Village real estate market is up 19% in dollar sales to $139M from $117M same time last year and no change in unit sales with (43) in 2017 versus (43) last year.
The number of under contract properties for the combined Aspen Snowmass Village market is up 52% to (35) in Feb 2017 versus (23) same time last year.
Under Contracts are used as an indicator of future activity when compared to the prior year.
Aspen
In Aspen alone, dollar sales are up 26% to $100M 2017 YTD from $79M last YTD and up 23% in unit sales to (27) now versus (22) last YTD.
Inventory of Aspen homes for sale is incrementally up 4% above last year, (170) in 2017 YTD versus (163) last YTD.
Aspen condo inventory is down 21% to (169) in 2017 YTD versus (213) last YTD.
February 2017 Statistics Summary for Aspen Only *
Aspen condos sales February 2017
Unit Sales: 0% (6) in February ‘17 from (6) in February ‘16
Dollar Sales: -41% $13M in February ‘17 from $22M in February ‘16
Inventory Active Listings: -21% (169) in February ‘17 from (213) in February ‘16
Aspen condos sales YTD through Feb 28, 2017
Unit Sales: +7% (15) in February ‘17 from (14) in February ‘16
Dollar Sales: +5% $35M in February ‘17 from $34M in February ‘16
Inventory Active Listings: -17% (184) in February ‘17 from (223) in February ‘16
Aspen Single family homes sales February 2016
Unit Sales: 0% (3) in February ‘17 from (3) in February ‘16
Dollar Sales: +57% $28M in February ‘17 from $18M in February ‘16
Inventory Active Listings: +4% (170) in February ‘17 from (163) in February ‘16
Aspen Single family homes sales YTDthrough Feb 28, 2017
Unit Sales: +33% (8) in February ‘17 from (6) in February ‘16
Dollar Sales: +66% $52M in February ‘17 from $31M in February ‘16
Inventory Active Listings: +4% (170) in February ‘17 from (163) in February ‘16
* Typically, the Aspen market represents 70-75% of the total combined Aspen Snowmass Village real estate marketplace.
Links to Feb 2017 Aspen and Snowmass Village Sold Properties: Photos and Details
Aspen Feb 2017 Closed Properties (9).This link is valid until 4/1/2017.
Snowmass Village Feb 2017 Closed Properties (7).This link is valid until 4/1/2017.
Vacant Lots Feb 2017 Closed Properties (2).This link is valid until 4/1/2017.
Disclaimer: The statements made in The Estin Report represent the opinions of the author and they should not be relied upon exclusively to make real estate decisions. Information concerning particular real estate opportunities can be requested from Aspen real estate broker agent Tim Estin at 970.309.6163 or by email at the contact page. A potential buyer is advised to make an independent investigation of the market and of each property before deciding to purchase. Your opinions may be different. To the extent the statements made herein report facts or conclusions drawn from other sources, the information is believed by the author to be reliable. However, the author makes no guarantee concerning the accuracy of the facts and conclusions reported herein and the information provided herein is subject to change.
The Estin Report is copyrighted 2017 and all rights are reserved. Use is permitted subject to the following attribution with an active link to the source: “The Estin Report on Aspen real estate.”
