

Released June 5, 2018 v.1.75
Yodel from the Mountains! Estin Report: May 2018 Aspen Snowmass Real Estate Market
The Estin Report: May 2018 Aspen Snowmass Real Estate Market Snapshot is a 10-Page statistical breakdown of monthly and year-to-date sales in detail. Download PDF from the right side of this page; highlighted charts and metrics appear below. The Snapshots are posted on or near the 1st Monday of the month. It is the only monthly Aspen market report to be published in a consistent and timely manner.
Bottom Line
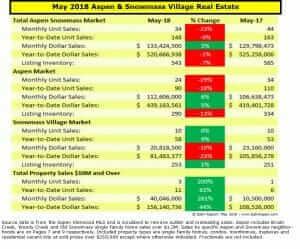
Total Aspen listing inventory of all property types for sale – homes, condos and lots/land – has fallen 38% in the past two years from 471 listings in May 2016 to 290 in May 2018: Single family home inventory is down 20%, from 175 to 133; condos down 50%, 234 to 119; lots down 40%, 62 to 38.
For the three most in-demand Aspen neighborhoods, the falling inventory issue is even more pronounced: In the 3 month period from Mar thru May 2018 compared to same period last year, Downtown Core condo and townhome sales were off -47%, 17 vs 32 sales; Historic West End home sales were off -67%, 2 vs 6 sales; Red Mountain home sales were off -71%, 1 vs 7 sales.
This shortage is producing higher prices, fewer choices and less negotiating room especially for newer, more contemporary and well-located properties for sale. The result is slowing sales.
Or…consider alternatives.
Fix up tired properties – if you can find them not already premium priced – market them as “like-new contemporary” and sell at the “new product” premium if possible.
Build new which will take 2 1/2 – 3 years at best: allowing for 9-12 months for design, planning and permitting, steadily rising construction costs and labor shortages, 18-24 months construction period, all mixed with countless delays, frustrations and approval changes and snafus.
Whether finding fixer-uppers or building new, see Aspen homes for sale Flip Jobs Before/After Section for what others have done.
Summary Stats
(Click on image to enlarge.)
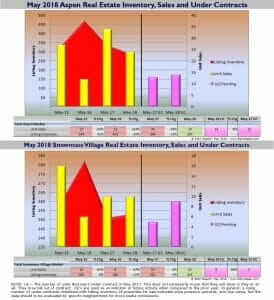
May 2018 Sales, Inventory of Active Listings and Under Contracts
(Click on image to enlarge.)
Deep Dive: Sales by Neighborhoods
(Click on images to enlarge.)


May 2018 Market Statistics Summary for Aspen Only *
Aspen condo sales May 2018
- Unit Sales: -24% (13) in May ‘18 from (17) in May ‘17
- Dollar Sales: +28% $27M in May ‘18 from $21M in May ‘17
- Inventory Active Listings: -13% (119) in May ‘18 from (136) in May ‘17
Aspen condo sales YTD
- Unit Sales: -24% (48) in May ‘18 from (62) in May ‘17
- Dollar Sales: +34% $156M in May ‘18 from $117M in May ‘17
- Inventory Active Listings: -23% (178) in May ‘18 from (233) in May ‘17
Aspen single family home sales May 2018
- Unit Sales: -47% (8) in May ‘18 from (15) in May ‘17
- Dollar Sales: -24% $63M in May ‘18 from $84M in May ‘17
- Inventory Active Listings: -10% (133) in May ‘18 from (148) in May ‘17
Aspen single family home sales YTD
- Unit Sales: -12% (36) in May ‘18 from (41) in May ‘17
- Dollar Sales: -10% $254M in May ‘18 from $282M in May ‘17
- Inventory Active Listings: -9% (198) in May ‘18 from (218) in May ‘17
* Typically, the Aspen market represents 70-75% of the total combined Aspen Snowmass Village real estate marketplace.
YTD: Year to Date
May 2018 Market Statistics Summary for Snowmass Village Only
Snowmass Village condo sales May 2018
- Unit Sales: +20% (6) in May ‘18 from (5) in May ‘17
- Dollar Sales: +23% $7M in May ‘18 from $6M in May ‘17
- Inventory Active Listings: +8% (169) in May ‘18 from (157) in May ‘17
Snowmass Village condo sales YTD
- Unit Sales: +15% (39) in May ‘18 from (34) in May ‘17
- Dollar Sales: -21% $28M in May ‘18 from $35M in May ‘17
- Inventory Active Listings: +8% (239) in May ‘18 from (221) in May ‘17
Snowmass Village Single family home sales May 2018
- Unit Sales: -20% (4) in May ‘18 from (5) in May ‘17
- Dollar Sales: -21% $13M in May ‘18 from $17M in May ‘17
- Inventory Active Listings: -9% (77) in May ‘18 from (85) in May ‘17
Snowmass Village Single family home sales YTD
- Unit Sales: +19% (19) in May ‘18 from (16) in May ‘17
- Dollar Sales: -9% $53M in May ‘18 from $48M in May ‘17
- Inventory Active Listings: +4% (103) in May ‘18 from (99) in May ‘17
* Typically, the Snowmass Village market represents 25-30% of the total combined Aspen Snowmass Village real estate marketplace.
Links to May 2018 Aspen and Snowmass Village Sold Property Photos and Details
Aspen May 2018 Closed Properties (21). This link is valid until 6/31/2018.
Snowmass Village May 2018 Closed Properties (10). This link is valid until 6/31/2018.
Vacant Lots May 2018 Closed Properties (6). This link is valid until 6/31/2018.
_____________________________
