

Released 11.09.20 v2.0. Data collected Mon 11.02.20 after 6PM MT.
Bottom Line: The rush to buy continued in Oct 20, second only to Sep 20’s record topping performance. I was recently asked the following questions by an Aspen journalist. My response follows:
Q: Given the sales activity of the summer and now into fall, do you think prices are nearing the top of this real estate cycle?
Prices of new listings coming onto the market at present are 15-30% above the most recent comparable solds. This is in part due to low inventory of properties for sale and part due to the “Covid premium”, the surging sales demand due to what we have been calling the “great urban exodus” resulting in higher prices.
In a rising market with low inventory, pricing is more a function of what’s available in a particular price range than the most comparable sales. Today’s sold is tomorrow’s comp.
Q: Are these rising prices sustainable?
Logic says no but we are in unprecedented times now, and in the past 40 years the long-term trend for local real estate prices has been skyward. Can they keep rising? …Barring unforeseen circumstances, why would it not? Aspen is surrounded by 92% undevelopable public and preserved land limiting supply, coupled with some of the strictest zoning regulations in the country and demand for such a uniquely beautiful area continues to grow. (see article).
Buyers may get discouraged and simply walk in order to wait for a downturn but how long does one really want to wait if they have a family and kids and grandchildren and Aspen Snowmass time together is so limited and finite? If there’s anything the past 6 years – since the current post recession market run-up commenced in early spring 2014 – and the 40 years between 1968-2008 have demonstrated, it’s that Aspen prices continue to rise and buyers who have waited for a correction during this period are paying an expensive waiting game financially and time-wise.
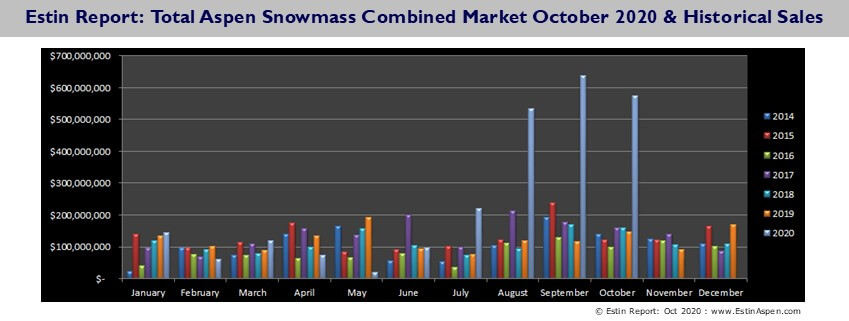
Key Oct 2020 Market Stats
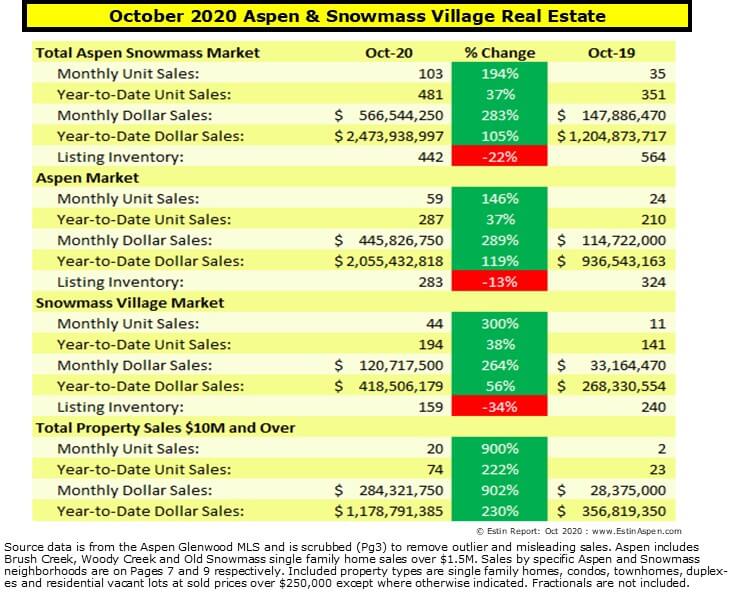
>YTD Jan 1- Oct 31, the total combined Aspen Snowmass real estate market is up 105% over last year, $2.47B vs $1.20B and unit sales are up 37%, 481 vs 352 (Pg 5).
> In Oct 2020 alone, there were (20) property sales over $10M vs (2) in Oct 19, up 900%.
YTD, there have been (77) sales of properties over $10M vs (24) last year, up 222%.
Sales of properties > $10M
2020 – 77 = thru Oct 31, 20 YTD…77 now vs 24 same time last yr, +221% above last year so far. The average annual # of properties over $10M sold in the past 6 yrs is 17.5 per year. In 2020 YTD, 77 versus 17.5 annual average in past 6 years, which is 340% above the avg.
2020 – 77 (avg sold price $15.7M/$2,260 sq ft)
2019 – 24 (avg sold price: $14.6M/$2,078 sq ft )
2018 – 24 (avg sold price $13.5M/$2,136 sq ft)
2017 – 26 (avg sold price $15M/$1,984 sq ft)
2016 – 11 (avg sold price $12M/$2,013 sq ft)
2015 – 26 (avg sold price $14.2M/$1,849 sq ft)
2014 – 18 (avg sold price $14.1M/$1,6547 sq ft)
> YTD Jan 1- Oct 31, sales of properties $10M and over (77) accounted for 16% of all unit sales (481) and 48% ($1.18B) of all dollar sales ($2.47B).
>Total market dollar sales in Oct 2020 were almost 3X more than Oct 2019.
> Future indicator: In Oct 20 there were (50) Aspen properties that went under contract/pending vs (15) in Oct 19, +213% – most of these will close in Nov & Dec 20; in Snowmass, there were (35) under contracts in Oct 20 vs (16) same time last year, up 119%.
> Listing inventory of properties for sale continues to fall to its lowest level in the past 10 years. In Aspen, inventory of all property types is 51% lower than ten years ago (Oct ’11); in Snowmass Village, it is 40% lower. (Pgs 6 & 8).
> Rising prices: Most new listings coming onto the market in Aug – Oct are priced on average 15-30% above Mar-Jun 20 sold comparables and the pre-Covid 19 quarantine period – call it the “Covid premium”.
> Pricing is largely a function of what’s available at a particular price-point combined with recent sold comparables. In general, choices of properties for sale has diminished and prices have rocketed upwards.
>Median sold price for Aspen single family home in Oct 20: $10.6M/$1,785 Sq Ft
>Median sold price for Aspen condo in Oct 20: $2.93M/$2,131 Sq Ft (Pg 4)
For average Aspen prices by property type and by neighborhoods, see Pg 7.
>Median sold price for Snowmass Village single family home in Oct 20: $3.77M/$961 Sq Ft (Pg 4)
>Median sold price for Snowmass Village condo in Oct 20: $1.13M/$858 Sq Ft (Pg 4)
For average Snowmass Village prices by property type and by neighborhoods, see Pg 9.
> For examples of Before/After property sales activity, see Estin Report/Flip Jobs
Aspen Only: October 2020 Market Statistics Summary
Aspen condo sales October 2020
- Unit Sales: +200% (24) in Oct ‘20 from (8) in Oct ‘19
- Dollar Sales: +524% $98M in Oct ‘20 from $16M in Oct ‘19
- Inventory Active Listings: +11% (122) in Oct ‘20 from (110) in Oct ‘19
Aspen condo sales YTD
- Unit Sales: +21% (139) in Oct ‘20 from (115) in Oct ‘19
- Dollar Sales: +113% $544M in Oct ‘20 from $255M in Oct ‘19
- Inventory Active Listings: +19% (321) in Oct ‘20 from (268) in Oct ‘19
Aspen Single family home sales October 2020
- Unit Sales: +114% (30) in Oct ‘20 from (14) in Oct ‘19
- Dollar Sales: +247% $321M in Oct ‘20 from $92M in Oct ‘19
- Inventory Active Listings: -18% (139) in Oct ‘20 from (169) in Oct ‘19
Aspen Single family home sales YTD
- Unit Sales: +94% (136) in Oct ‘20 from (70) in Oct ‘19
- Dollar Sales: +154% $1,440M in Oct ‘20 from $568M in Oct ‘19
- Inventory Active Listings: +18% (345) in Oct ‘20 from (291) in Oct ‘19
*Typically, the Aspen market represents 70-75% of the total combined Aspen Snowmass Village real estate marketplace. The following Aspen Oct 2020 sales are considered outliers – they have been counted in total dollar and unit sales but are not included in the average price $/sq ft metrics within this report. Outliers: 158379 Aspen Village mobile home, 166275 Lazy Glen mobile home.
Snowmass Village Only: October 2020 Market Statistics Summary
Snowmass Village condo sales October 2020
- Unit Sales: +271% (26) in Oct ‘20 from (7) in Oct ‘19
- Dollar Sales: +387% $44M in Oct ‘20 from $9M in Oct ‘19
- Inventory Active Listings: -26% (114) in Oct ‘20 from (155) in Oct ‘19
Snowmass Village condo sales YTD
- Unit Sales: +33% (133) in Oct ‘20 from (100) in Oct ‘19
- Dollar Sales: +83% $190M in Oct ‘20 from $104M in Oct ‘19
- Inventory Active Listings: +2% (329) in Oct ‘20 from (321) in Oct ‘19
Snowmass Village Single family home sales October 2020
- Unit Sales: +325% (17) in Oct ‘20 from (4) in Oct ‘19
- Dollar Sales: +212% $75M in Oct ‘20 from $24M in Oct ‘19
- Inventory Active Listings: -45% (41) in Oct ‘20 from (75) in Oct ‘19
Snowmass Village Single family home sales YTD
- Unit Sales: +50% (57) in Oct ‘20 from (38) in Oct ‘19
- Dollar Sales: +37% $220M in Oct ‘20 from $161M in Oct ‘19
- Inventory Active Listings: -7% (136) in Oct ‘20 from (147) in Oct ‘19
* Typically, the Snowmass Village market represents 25-30% of the total combined Aspen Snowmass Village real estate marketplace.. The following Snowmass Village Oct 2020 sales are considered outliers. They have been counted in total dollar and unit sales but are not included in average price $/sq ft metrics within this report.
Stonebridge studio condos: 166294, 144141
Links to Oct 2020 Aspen and Snowmass Village Sold Property Photos and Details
Aspen Oct 2020 Closed Properties. This link is valid until 11/31/2020.
Snowmass Village Oct 2020 Closed Properties. This link is valid until 11/31/2020.
Vacant Lots Oct 2020 Closed Properties. This link is valid until 11/31/2020.
