

Released online as PDF on Feb 7, 2015 v6.5. The 4th Quarter is Oct 1 – Dec 31st. The print edition is available after Feb.19th on racks around town, the airport, and outside the Sotheby’s offices at 415 Hyman Ave Mall and 300 Spring St (my office) opposite the Aspen Art Museum.
Click cover image for full 24-page report
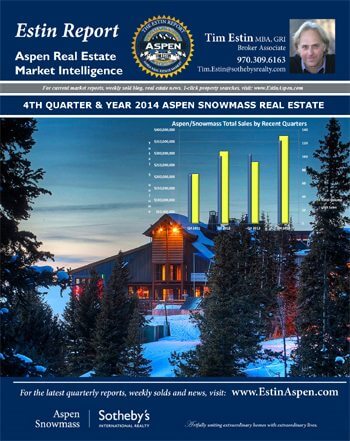
2014 Year Aspen and Snowmass Real Estate*
Summary
2014 is the best performing year for Aspen Snowmass Real Estate since 2007. Along with positive economic news across the country, a strong and confident Aspen market has returned.
And the momentum continues…Jan 2015 has been the best January in seven years.
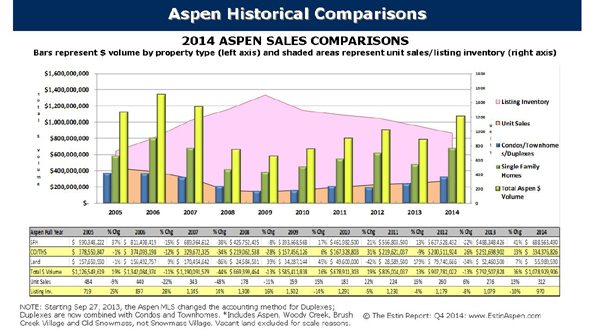
For the Year 2014, the number of units sold for the total Aspen Snowmass combined market rose 4%, from (432) units in 2013 to (451) units in 2014, and dollar sales increased 28% from $1.0B in 2013 to $1.29B in 2014.
In 2014, the Aspen market alone – without Snowmass Village sales – represented 86% of total combined Aspen Snowmass Village sales dollars and 71% of all unit sales. Aspen unit sales were up 13% for the year, from (276) in 2013 to (312) in 2014, and dollar sales were up 36% from $792M in 2013 to $1.1M in 2014.
A significant increase of unit sales of Aspen homes in the $5M-$15M range accounts for a 24% increase in single family home sales with (130) homes sold in 2014 versus (105) in 2013. The price points showing the most sales increases are: $7.5-9.9M increased 225% from (4) to (13) sales; $10M-14.9M up 100% from (7) to (14) sales, and $20M+ sales are up 200% from (1) to (3) sales. The one exception to upward home sales was in the $1M-2M category which fell 42% because so little home inventory is for sale in this range.
The average Aspen home price is $5.2M in 2014 versus $4.6M in 2013, up 14%. The median home price, considered a more reliable metric as less skewed by extreme high or low priced sales, is $4.2M in 2014 over $3.2M in 2013, up 30%, as the larger, newer and, therefore, more expensive homes sold especially well.
Average and median Aspen condo prices are up significantly as new and/or newly remodeled units continue their strong sales momentum forcing up the average metrics. The average 2014 condo price is $2.1M versus $1.7M in 2013, up 24%; the median 2014 condo price is $1.3M over $1.2M in 2013, up 11%. This explains the 33% spike in condo dollar sales from $252M in 2013 to $335M in 2014 while unit sales increased 6%. The average 2014 condo price per sq ft jumped 20% to $1,175 sf from $970 sf in 2013.
A continued decline in Aspen listing inventory is becoming an issue especially in specific market segments. New and like-new product is in short supply and high demand. Historically solid locations such the West End, Red Mountain and the Aspen Core are seeing incrementally rising home prices. And well located condos with high walkability scores and/or locational advantages – near the Gondola, those with Aspen Mountain views, directly on the river – are selling well.
For buyers in general, high quality choices are narrowing.
After essentially a 5-year “pause” in new residential construction, activity is returning full speed ahead in 2014. Some factual and anecdotal indicators are:
- Word on the street is that everyone in the trades is getting very busy – designers, architects, high quality contractors, subs.
- Mortgage and construction lending is freeing up.
- Labor prices and cost of materials are on the rise, and, importantly, because so many tradespeople left the industry post crisis in the past 5 years, a labor shortage is predicted
- City building permit application process now takes 4-6 mos. versus 1-2 mos. in 2010 – 2013
- City of Aspen/Real Estate Transfer Tax (RETT) Revenue: Properties sold within the City of Aspen are subject to a 1.5% transfer tax at closing payable by the buyer. The tax is made up of approximately 1% for the Aspen Housing Real Estate Transfer Tax (HRETT) and .5% for the Wheeler Opera House (WRETT). Recent revenue collections are:
o HRETT collections for Dec 2014 were up 150% over Dec 2013 and up 48% for all of 2014.
o WRETT collections for Dec 2014 were up 126% over Dec 2013 and up 44% for all of 2014. (City of Aspen Finance Dept.)
- Buyers continue to look for value and, when considering scrapers and remodels, to seek ways to capture additional sq. footage in order to add value and improve exit options
- Consensus view – we are about 12 months into a new cycle, not a boom…yet. However, a redevelopment cycle is definitely ramping up.
- It’s going to get busier.
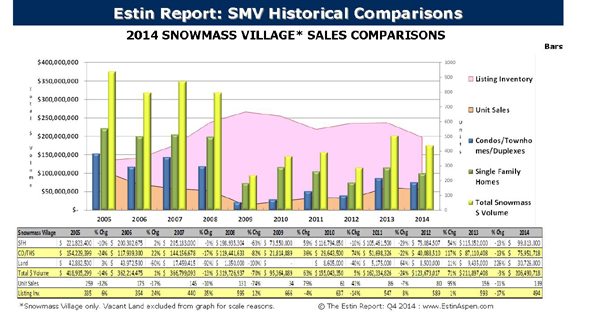
SMV home sales, in general, increased 23% from 30 sales in 2013 to 37 sales in 2014. The average home price was $2.7M in 2014 versus $3.8M in 2013, down 30%; the median price was $1.9M in 2014 versus $2.1M in 2013, down 7%. And the average price per sq ft was $670 in 2014 versus $679 in 2013, up 1%.
The $1-2M home price category had the most sales by far with (18) sales in 2014 over (10) in 2013, up 80%. With extremely tight inventory at this price-point, buyers have been forced to step up to the $2-3M range.
SMV condo sales fell 30%, from 118 sales in 2013 to 83 in 2014, due largely to fewer Viceroy Hotel and Condo sales year over year. Their sales program launched aggressively in early Jan 2013 with 60% discounts from pre-recession prices, and the fall off is due to the natural maturation of that program. The success of the Viceroy sales has brought well-needed attention to the entire SMV condo market and as a result, sales expanded to other condo complexes while Viceroy sales dropped off. (A phase II Viceroy program is in its late planning stage.)
The average SMV condo price was $915,000 in 2014 versus $738,000 in 2013, up 24%; the median price was $651,000 in 2014 versus $525,000 in 2013, up 24%. And the average price per sq ft was $653 in 2014 versus $668 in 2013, down 2%.
SMV vacant land sales have been particularly strong as builders/developers and end-users found values unavailable in Aspen. There were (19) Snowmass lots sales in 2014 over (8) in 2013, up 138%. In dollars, lots sales were $31M in 2014 over $9M in 2013, up 226%.
In general, prices in Snowmass Village are still down as good values persist compared to Aspen. But inventory is falling suggesting the window for deals may be narrowing.
__________________
2014 YEAR – VITAL STATS
ASPEN
Aspen Homes
-Average Price $5.2M in 2014 versus $4.6M in 2013, up 14%
-Median Price: $4.2M in 2014 versus $3.2M in 2013, up 30%
-Average Price per Sq Ft: $1,044 sf in 2014 versus $987 sf in 2013, up 6%
-Number of Sales: (130) in 2014 versus (105) in 2013, up 24%
-Listing Inventory: (564) in 2014 versus (600) in 2013, down 6%
Aspen Condos
-Average Price: $2.1M in 2014 versus $1.7M in 2013, up 24%
-Median Price: $1.3M in 2014 versus $1.2M in 2013, up 11%
-Average Price per Sq Ft: $1,175 sf in 2014 versus $979 sf in 2013, up 20%
-Number of Sales: (156) in 2014 versus (147) in 2013, up 24%
-Listing Inventory : (733) in 2014 versus (868) in 2013, down 16%
SNOWMASS VILLAGE (SMV)
Snowmass Village Homes:
-Average Price $2.7M in 2014 versus $3.8M in 2013, down 30%
-Median Price: $1.9M in 2014 versus $2.1M in 2013, down 7%
-Average Price per Sq Ft: $670 sf in 2014 versus $679 sf in 2013, up 1%
-Number of Sales: (37) in 2014 versus (30) in 2013, up 24%
-Listing Inventory: (131) in 2014 versus (138) in 2013, down 5%
Snowmass Village Condos
-Average Price: $915K in 2014 versus $738K in 2013, up 24%
-Median Price: $651K in 2014 versus $525K in 2013, up 24%
-Average Price per Sq Ft: $653 sf in 2014 versus $668sf in 2013, down 2%
-Number of Sales: (83) in 2014 versus (118) in 2013, down 23%
-Listing Inventory: (323) in 2014 versus (419) in 2013, down 23%
*The report documents residential real estate sales activity for the 4th Quarter 2014 (Oct 1—Dec 31, 2014) and Full Year 2014 (Jan 1—Dec 31, 2014) in the upper Roaring Fork Valley: Aspen, Snowmass Village, Brush Creek, Woody Creek and Old Snowmass. The properties types included are single family homes, condos, townhomes, duplexes and residential vacant land sold over $250,000. Fractionals are not included. The report compares Q4 2014 to Q4 2013, year over year results, and where indicated, to historical data since 2005. There are three sections: 1) Aspen/Snowmass total combined market; 2) Aspen market (includes Aspen, Woody Creek, Brush Cr. Village and Old Snowmass); 3) Snowmass Village market (the ski resort). The source data is the Aspen MLS which goes back 10 years.
Disclaimer: The statements made in The Estin Report and on Aspen broker Tim Estin’s blog represent the opinions of the author and should not be relied upon exclusively to make real estate decisions. A potential buyer and/or seller is advised to make an independent investigation of the market and of each property before deciding to purchase or to sell. To the extent the statements made herein report facts or conclusions taken from other sources, the information is believed by the author to be reliable, however, the author makes no guarantee concerning the accuracy of the facts and conclusions reported herein. Information concerning particular real estate opportunities can be requested from Tim Estin at 970.309.6163 or by email. The Estin Report is copyrighted 2015 and all rights reserved. Use is permitted subject to the following attribution with a live link to the source: “The Estin Report on Aspen Real Estate.”
_______________________________________
