

released Thurs. June 6, 2013 v9
Click image for Current Reports/May 2013 Market Snapshot Charts and Tables pdf
Summary
May 2013 versus May 2012
(Now vs Then, Year over Year)
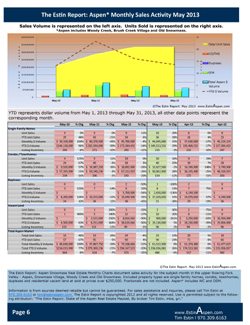
Total Aspen Snowmass Market
• Monthly Unit Sales: up 30%, 35 sales now vs 27 then
• Year-to-Date Unit Sales: up 30%, 161 sales now vs 124 then
• Monthly Dollar Volume: down -9%, $76M now vs $83M then
• Year-to-Date Dollar Volume: down -14%, $304M now vs $355M then
• Listing Inventory: down -12%, 978 properties for sale now vs 1,111 then
Aspen Market
• Monthly Unit Sales: down 4%, 23 sales now vs 24 then
• Year-to-Date Unit Sales: up 4%, 94 sales now vs 90 then
• Monthly Dollar Volume: down -22%, $62M now vs $79M then
• Year-to-Date Dollar Volume: down -20%, $236M now vs $294M then
• Listing Inventory: down -15%, 486 properties for sale now vs 573then
Snowmass Village Market
• Monthly Unit Sales: up 300%, 12 sales now vs 3 then
• Year-to-Date Unit Sales: up 97%, 67 sales now vs 34 then
• Monthly Dollar Volume: up 263%, $14M now vs $4M then
• Year-to-Date Dollar Volume: up 12%, $68M now vs $61M then
• Listing Inventory: down -9%, 258 properties for sale now vs 284 then
Live links to May 2013 sold property photos and details
Aspen Solds May 1 – 31, 2013 (26 solds): This link is valid until 7/5/2013.
Snowmass Village Solds May 1 – 31, 2013 (13 solds): This link is valid until 7/5/2013.
Vacant Land Solds May 1 – 31, 2013 (2 solds): This link is valid until 7/5/2013.
The Estin Report: Aspen Snowmass Real Estate Monthly Charts document sales activity for the subject month in the upper Roaring Fork Valley – Aspen, Snowmass Village, Woody Creek and Old Snowmass. Included property types are single family homes, condos, townhomes, duplexes and residential vacant land at sold at prices over $250,000. Fractionals are not included. Aspen* includes WC and OSM.
