

Scroll down page for prior week’s market activity. If you like this site, please click the “Like” button above.
About this Report
This Aspen Snowmass real estate report documents sales activity for the 4th Quarter and full Year 2011 for the upper Roaring Fork Valley – Aspen, Snowmass Village, Woody Creek and Old Snowmass. Included property types are single family homes, condos, townhomes, duplexes and residential vacant land at sold at prices over $250,000. Fractionals are not included. The report compares 2011 to 2010, prior quarter and prior year quarter and historical data since 2004. There are three sections: Aspen/Snowmass total market, Aspen market (includes small Woody Creek and Old Snowmass areas) and Snowmass Village (the ski resort) market. The source data is from the Aspen/Glenwood MLS.
Click image or link to full report pdf with charts and graphs
(An Index of Charts and Graphs is available on Pg 2 of the report.
Please contact Tim Estin for chart jpg images if desired.)
Executive Summary
Total Aspen Snowmass Market
Year over year, the 2011 total Aspen and Snowmass real estate market is up +15% in dollar sales and +25% in unit sales over 2010 due to the strength of the first half of the year.
Quarterly comparisons this year indicate a loss of momentum in the 2nd half of the year.
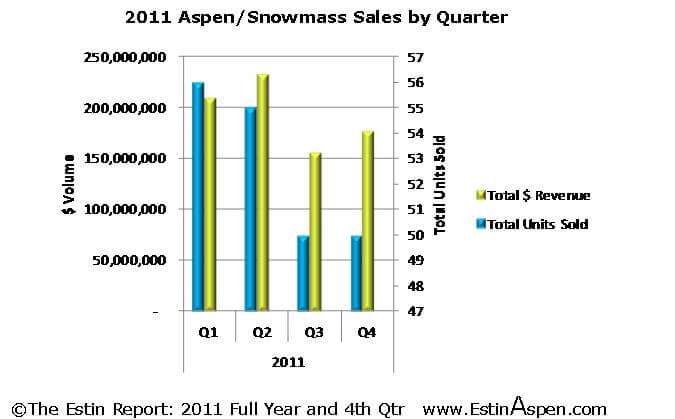
Q4 2011
• $176.3M (+13% from Q3 2011)
• 50 unit sales (no change from Q3 2011)
Q3 2011
• $156M dollar sales (-33% from Q2 2011)
• 50 unit sales (-9% from Q2 2011)
Q2 2011
• $233M dollar sales (+11% from Q1 2011)
• 55 unit sales (-2% from Q1 2011)
Q1 2011
• $209M dollar sales
• 56 unit sales
Whether this drop-off is temporary or longer lasting remains to be seen but positive macro economic news at the end of the 2011 bodes well for the beginning of the new year. However, the lack of snow in late December and early January is just one more element of uncertainty in the real estate mix to be considered.
Aspen Market
Sales
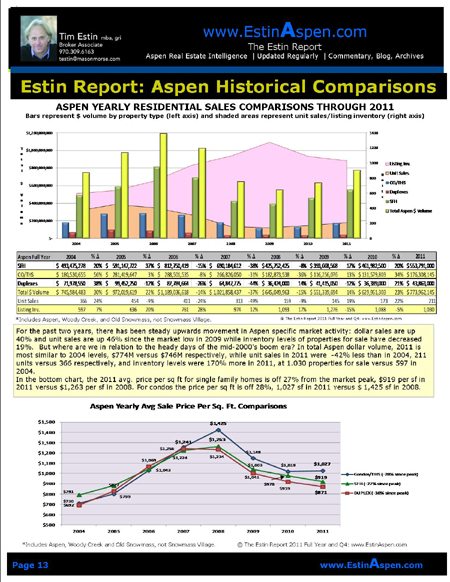
• Since the market low in early 2009, Aspen total dollar sales are up 40% and unit sales are up 46% while the inventory levels of properties for sale have decreased 19%.
Compared to the mid-2000’s boom era:
• 2011 overall market activity is most similar to 2004 levels.
• Dollar volume in 2011 was $774M versus $746M in 2004.
• Unit sales in 2011 were -42% less than 2004, 211 units sold versus 366.
• Inventory levels were 170% more in 2011 than 2004, at 1,030 properties for sale versus 597.
Average Price per Sq Ft
• Aspen single family home average price per sq ft is off 27% from the market peak in 2008, $919 per sf in 2011 versus $1,263 per sf.
• Aspen condo average price per sq ft is off 28% since 2008, $1,027 sf in 2011 versus $ 1,425 sf then.
Aspen Home Market Activity and How Much Time to Sell
• Aspen single family home dollar sales in 4Q11 are off -18% from 4Q10 while full year 2011 Aspen single family dollar sales are up +20% indicative of the drop-off in activity in July—Sept. ‘11.
• Aspen single family unit sales in 4Q11 are down -16% from 4Q10 but full 2011 year Aspen sf home unit sales for all of 2011 are up +19%. Again, the year was strong but the second half was not.
• The amount of time it takes to sell an Aspen home, days on market, is up 10%, 428 days in 2011 versus 390 days in 2010.
Median Aspen Home Prices
• Aspen median home sale prices are off another 10% from a year ago. (Median is a more reliable indicator of price information as averages can be skewed significantly by either very large or small property sales.)
• As sellers become more realistic about their ask prices, the gap between ask and sold price is narrowing which explains why Aspen single family home prices are now selling at 85% sold to ask in Q4 2011 versus 77% in Q4 2010.
Aspen Condo Market
• The brightest light in 2011 sales overall is the significant improvement in condo sales — all condo metrics are positive.
• In the Aspen condo market, there was little change in year over year 4th quarter activity, 4Q11 vs 4Q10. But condo sales for 2011 full year were up +23% in unit sales and +34% in dollar volume.
• Condo prices appear to have stabilized in 4Q11 over 4Q10, and the average price per sq ft has even risen slightly +7% from $942 sf to $1,004 sf in 4Q11.
• The average amount of time it takes to sell a condo, days on market, has declined slightly, -5%, 2011 over 2010 from 346 days to 331 days.
Aspen Duplexes
• Duplexes are an incremental portion of the entire market but broken out separately in the MLS.
• Duplex sales are up 21% in dollar sales and 36% in unit sales for full year 2011 versus 2010. Perhaps duplexes are perceived as better values than either homes or condo/townhomes, as their average $871 price per sq ft is the least amongst all property types in this report.
Aspen Price Points
• Both ends of the spectrum, under $2M and above $10M, showed the biggest changes over the year. There were 25 sales under $2M in 2011 versus 13 in 2010, a +92% change.
• The under $1M category represents the single best values in Aspen on a price per sq ft basis selling at considerable price per sq ft discounts relative to the rest of the market.
• In the over $10M category, there were 16 sales in 2011 versus 10 in 2010, a +60% difference. This is the category getting all the national media attention throughout 2011. It accounts for 45% of the total Aspen single family home dollars spent in 2011 versus 33% of the total in 2010, a 64% increase in dollars.
What Aspen Areas are Selling: Geography?
• In Nov/Dec, there were two very expensive ($16M and $20.75M) Red Mtn home sales which skewed the geographic distribution of dollar sales heavily to Red Mtn. Were it not for those sales, the distribution pattern of dollar sales would have been more evenly spread amongst all Aspen areas. Single family home sales are continuing to expand outward geographically from the downtown Core and West End, which in the 1st half of 2011 accounted for 50% of unit sales and 43% dollar volume versus 24% and 27% respectively in 4Q 2011. Geographic expansion of market activity is a healthy signal of an improving market.
Snowmass Market
Market size
• The Snowmass Village home and condo market at $154.8MM in sales for 2011 represents only 17.5 % of the total Aspen Snowmass home and condo (residential w/improvements) market combined at $885.3MM.
Prices
• Snowmass Village average price per sq. ft. fell another -9% for single family homes and -11% for condos in the year 2011 over 2010. Since their market peaks in 2007-2008, Snowmass single family home average price per sq ft prices are off -42% and off -40% for Snowmass condos.
• Snowmass condo unit sales increased +83% to 55 units in 2011 from 30 in 2010, and condo dollar sales volume was up 67% due to lower prices and buyer’s sense of value at today’s discounts. Snowmass condos offer superb slopeside ski in/out, rental income opportunities and excellent value especially when compared to Aspen prices.
SMV Price Points – What’s Selling?
• The price category with the most Snowmass single family home sales in both 2011 and 2010 is $3M-4.99M. The price category with the greatest increase in unit home sales was the under $1.99M group with (8) sales in 2011 versus 5 sales in 201, a +60% increase. What was once $3M+, is now $2M +/-.
• The higher end of Snowmass home sales, above $7.5MM, accounted for 42% of total Snowmass home sale dollars and 12% of total home units sold. In 2010, this group represented 34% of total Snowmass home sale dollars and 15% of total home units sold.
Quarterly Comparisons
• In Q411 YTD, condominium sales dominated the Snowmass Village (SMV) market. Condo unit sales (13 units) accounted for 72% of total units sold (18 units) and 45% of dollar sales. Compared to a year ago 4Q10, condo sales were up +117% in unit sales from 6 to 13 units, while home sales decreased -29% from 7 unit sales in 4Q10 to 5 in Q411.
How Much Time to Sell?
• The amount of time (days on market) it takes to sell a SMV condo decreased -18% from 717 days to 585 days, while the time it took to sell a SMV home decreased an incredible -48% from 335 days in 2010 to 175 in 2011. Possible explanation: those 2011 home sales sold at 85% of their original list prices suggesting they were better priced to begin with than homes that sold in 2010 at 70% of their original ask price.
Vacant Lots – Aspen and Snowmass
Residential vacant land sales are still moribund. There were (9) vacant lot sales in 2011, the lowest number of annual lot sales going back to 2004. These (9) sales represent 13% of unit sales in the peak year 2005 when (112) lots traded. For more perspective, 2011 lot sale dollar volume accounted for just 15% of the lot sale dollar volume in 2005. The 2011 sales that have occurred are largely distressed, highly motivated situations.
• Two 2011 Lot Sale Examples:
1.) Byers Court/WJ Ranch: In early Jan 2012, a Byers Court/WJ Ranch subdivision 2.2 acre big view lot off McLain Flats Rd closed at $854,000. The pricing history of this 5-lot subdivision created in 2006: two lots sold at $3.75M in April 2008 and $4M in Dec. 2006. In late 2010, unsold Byers lots were offered at $1.8M – $2M. Their original ask prices in 2006 were between $4M – $5.75M. There are currently (2) lots available at $1.8M.
2.) Sinclair Meadows, Snowmass Village: Snowmass’s newest residential home subdivision came on the market in April 2008 with 1/3 – 2/3 acre lots priced at $1.55M to $2.825M. Four (4) of the total residential vacant lot sales in 2011 were Sinclair Meadows lots selling in the $600,000’s for the originally listed $1.55M lots and $1.3M for the originally listed $2.825M lot(s).
• Build versus Buy
As mentioned in earlier reports this year, in many cases it should be less expensive now to buy land and build than to purchase an existing home. This is typically a tipping point when land sales and new construction should start to pick up.
Market Overview
Since the Crisis began in the fall 2008, there has been an overwhelming sense amongst most of moorings upended, of our reference points being displaced by never-to-be-believed or who-would-have-thought new realities. The positivism and perhaps naive optimism of the mid-decade has been replaced by a pervasive sense of uncertainty and not knowing what – or who – to believe in anymore. All of which is to say that it is difficult to put a positive note on much and that a measured, cautious attitude forward is what most of us can tolerate.
I believe most local Aspen real estate prognosticators have been proved wrong one way or another in the past few years, and that it is my greater purpose to uncover the facts of the marketplace as best possible, to dig deeper and tallow them to speak for themselves. My currency is fact and to tell the story accurately. In early 2011, Aspen real estate started off strong and positive only to get burned by unexpected global events whether Japanese earthquakes, US Congressional impasse or the Euro crisis, to name the major ones.
At this writing in early January 2012, there are known reasons for optimism – the unemployment numbers are the most positive they have been in more than 3 years, the Holiday retail season appears to have been strong and manufacturing levels are increasing. The Euro crisis has abated – at least temporarily – but it is surely to loom large and ominous for 2012. And as we all know now, Aspen is not insulated from these macro events.
Most of what I have written throughout 2011 in prior reports remains true, so I will repeat certain themes that continue to be relevant as we begin 2012.
In general, market prices have reset to a post-crisis level, off on average 25 – 40%, and in some individual cases more, from the 2008 market peak. But much depends on the property, unique circumstances and seller motivation. Prices remain under pressure, at least incrementally, even assuming they have been re-adjusted to the “new norm”.
It still remains unclear the extent to which we have in fact reached a bottoming of prices. The big question everyone asks is … are we still falling or are we scraping along a bottom?
As much of Aspen real estate activity is fed by our sense of well-being, there continue to be a number of reasons for uncertainty. Yes, we are a small mountain hamlet, but we all are connected now, and Aspen’s gold-leafed economic and social immunity has disappeared in the G5 age. If the stock market is up, it is likely that the local real estate market will mirror that and the converse applies as well.
On-going themes:
• Continued High Inventory Levels: Even though the inventory of total active listings has fallen –19% from its 2009 high, it continues to remain at historically high levels. There continue to be many more properties for sale than buyers, and over-supply under-demand translates into price pressure.
• Deal Savvy Buyers: While a sense of ‘missing the bottom’ is driving some buyers, others have adopted a ‘wait and see’ attitude. Unless motivated by a property they can’t live without at a price that demonstrates value, most prospective buyers will move on to the next property. Or continue to wait out the market. And even if these buyers get a property under contract, many continue to shop and deals are consistently falling out. Just ask a title company. The buyer rules in most cases.
• Lurking Shadow Inventory: There are a number of owners who’ve been pining to sell in the past three years who are waiting for improved market conditions. These properties will swell onto the marketplace as soon as there is a sense of relaxation of downward price pressure – but when there is this hint of relaxation, this invisible pent-up inventory will come onto the market and pricing pressure will again resurface. Think of it literally as waves of inventory. Price ‘relaxation’ is unlikely to occur in my estimation for at least the next 6-12 months if not longer until inventory levels subside. Those Aspen ‘pundits’ who say otherwise are misleading their public.
• Save Money and Build Option: Vacant lot sales are down 40-60% and in many cases, it should be less expensive now to buy land and build with construction costs down 20-30% than to purchase an existing home. Additionally, the Pitkin County approval process is more expedient now than in the boom days with an estimated 18-24 months to build now versus 24-36 months then. Lastly, as there is so little new construction taking place presently due to almost impossible financing conditions, by the time one completes the job in two years, there should be high demand for this new product priced at a premium because so little new residential supply will then be available.
• Uncertain US and Global Economic Picture: Every month a new set of numbers comes out with different conclusions and spin. This topsy-turvy pattern of volatile numbers every month solidifies our sense of vulnerability adding to the overall psychic fragility of this recovery. An Italian/Spanish/Irish default, Euro-contagion, another Japanese earthquake type event – on top of the 2008 economic crisis – have created a general mood of fragility and lack of optimistic conviction. This is not doomsday thinking, it is the 21st Century world in which we now live.
So. Critical Question: Has the Market Turned?
Yes, in that real estate activity has significantly picked up and has returned to a more “normal” pre-2005-2008 pace.
No, because while the rate of price discounting appears to have stabilized, for other than truly unique new or like-new properties in A-level locations, there continues to be pressure on sellers to further reduce – even if incrementally – to get the deal done if one truly wants or needs to sell. If not, one is best advised to not list one’s property. It is generally a tough, humbling experience for sellers.
To Sellers:
If buyers perceive a listing is priced mark-to-market (i.e. what would it take to sell today), or more commonly that “buyers perceive value”, properties stand a reasonable likelihood of selling within 2 – 8 months. If not, sellers risk ‘riding the market’ down in these well-known stages: starting high thereby immediately disinteresting buyers and brokers, the listing then becomes stale, competitive properties sell, and finally the seller capitulates 1-3 years later in order to sell at the price he could have sold for in the beginning if only he’d listened to his broker. Quite often, the property sells for less than what it would have if priced correctly in the beginning. This scenario repeats itself time and again.
Unfortunately, other factors such as the time value of money – it costs money to service a property, the opportunity cost to forgo better opportunities while a property – and the cash it ties up – sits on the market, and the importance of “getting on with it” as life moves on, are for the most part not pre-eminent pricing considerations by the seller when a property is initially listed.
Sellers should be realistic and match their motivations with their pricing.
To Buyers:
Find the property one loves, that one believes one may be able to afford, and make a bid at a level one is comfortable with. Making a written offer is the only way to get real information from the seller. See what happens. Negotiations have to start somewhere, and many properties are selling at levels even brokers have a difficult time believing. One never knows the real story…especially in this market.
What is Selling?
New. New. New construction homes and extensively remodelled – like new – condos or homes, large uniquely built homes whose size, quality and location are not easily reproduced, properties priced “to market” – representing clear value, and highly discounted vacant lots in B+ or above locations.
Disclaimer: The statements made in The Estin Report and on Tim Estin’s blog represent the opinions of the author and should not be relied upon exclusively to make real estate decisions. A potential buyer and/or seller is advised to make an independent investigation of the market and of each property before deciding to purchase or to sell. To the extent the statements made herein report facts or conclusions taken from other sources, the information is believed by the author to be reliable, however, the author makes no guarantee concerning the accuracy of the facts and conclusions reported herein. Information concerning particular real estate opportunities can be requested from Tim Estin at 970.920.7387 or Email him. The Estin Report is copyrighted 2012 and all rights reserved. Use is permitted subject to the following attribution: “The Estin Report: State of the Aspen Real Estate Market, By Aspen broker Tim Estin, mba, gri.”
_______________________________________________________________
