

Released Sept 13, 2018 v2.0
Click images to enlarge
Bottom Line
August 2018 continues a significant Aspen slowing trend in unit sales during the summer months of June-August 2018 over last summer. No property category – other than Snowmass Village and vacant lot/land sales – has been spared. Even the red hot downtown Aspen Core has experienced a slowing.
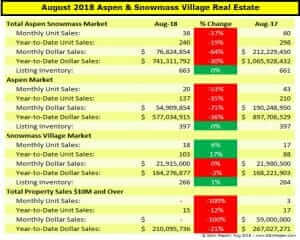
For 2018 YTD through Aug, Aspen total unit sales are off -35%, (137) in 2018 YTD vs (210) same time last year; Snowmass Village unit sales are up 17%, (103) in 2018 YTD vs (88) last year.
The number of under contracts or pendings in August — used as an indicator of future activity – is down -61% in Aspen and -19% in SMV. Closings usually occur 21 to 45 days from the date of a contract.
However, as this is written in mid-Sept, we are seeing a sharp increase in properties going under contract. It’s not possible yet to know if this present buyer surge will make up for lost ground over the summer as the uptick is typical this time of year. Buyers have searched over the summer and pull the trigger in early fall so their newly purchased property can be ready for the winter ski season. Sellers also tend to be more motivated as the summer season ends.
The City of Aspen real estate transfer tax (RETT) collections were down 50% and 49% percent for August. The RETT for real estate transactions within the City is 1.5% of the closing price payable by buyer – about 1% of this goes to fund Aspen’s affordable housing program and .5% to the historic Wheeler Opera House. There are two parts of the RETT Tax and year to date, the affordable-housing portion of the RETT is down 18% YTD from January through August from the same period in 2017 and the Wheeler portion is 18% behind from the same period in 2017.
Some reasons for the slowdown:
- Inventory of good and well-priced properties for sale is difficult to find and this is discouraging buyers – established brokers indicate that at least 60% of Aspen properties for sale is over-priced, a small number will even go so far to say as much as 90-95%. This is true, at minimum, to the extent that at the half year mark in June ’18 , Aspen single family homes were selling at approximately 89% to ask price and condos at 93% (ref: Estin Report 2018 YTD State of the Aspen Market, Pg 16 top).
- Buyer’s tastes and preferences have changed radically during and since the great recession as mentioned frequently in my reports of the past 4 years:
- New or like-new product is selling generally quickly, although a number of these listings are at ask prices without legit comps so they are lingering on the market waiting for that ONE sale which will establish a new comparable level.
- Buyers want to be in-town and are willing to pay the big price premium for that convenience – buying Aspen real estate is no longer necessarily about an Aspen/Rocky Mountain experience as much as it is being a part of the Aspen social experience. Almost all other properties for sale outside the roundabout are experiencing long Days on Market (DOM), and generally, it’s difficult for sellers to accept this new reality which is so different from their prior Aspen buying experience.
- Buyers will only buy on the outside if discounted accordingly – look no further than a recent extreme example, the sale of a Wildcat Ranch homestead – 2002 built, 13,000 sq ft home on 500 acres, just 20 min from Aspen that sold in late Aug at $9M from an original ask price of $37.5M in Oct. 2008… 10 years and -76% closed price later. If you’re a seller, do you want to follow the market down like this or is it time to get real?
- Buyers may be fearing we are at the market top. It’s reasonable to assume we are closer to the top than the bottom in 2010. But the counter to this is that all buyers I know say, “The best decision I’ve made in my life was buying this Aspen property…”, no matter when they bought. They also say…”Over the life and memories that this Aspen property has served me and my family, it hasn’t mattered as much when or what I paid as much as the decision to get into the market.”
- Contrarian view: If so many buyers believe the market is at its top, it will be either a self-fulfilling prophecy or a crash will happen at its own burn-out rate. A contrarian believes that such prevailing doubts are healthy and will hold the market in check. That such caution will sustain the market further and longer than most expect. This thinking is not just about Aspen real estate, it applies to any asset class that’s presently at record level and duration.
- Snowmass Village real estate is happening: the build out of Snowmass Base Village is nearing completion (Dec. 2018) and there’s contagious enthusiasm in the air. Located just 8 miles from Aspen, SMV real estate is basically priced at 40-60% off Aspen prices. Price matters. In all hoods and areas. See the recent Sep 9, 2018 Forbes article on the new Snowmass Village finally “getting some respect”.
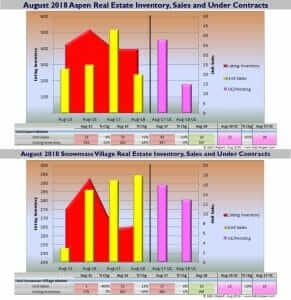
August 2018 Market Statistics Summary for Aspen Only *
Aspen condo sales August 2018
- Unit Sales: -67% (9) in August ‘18 from (27) in August ‘17
- Dollar Sales: -76% $16M in August ‘18 from $68M in August ‘17
- Inventory Active Listings: +3% (158) in August ‘18 from (154) in August ‘17
Aspen condo sales YTD
- Unit Sales: -28% (81) in August ‘18 from (112) in August ‘17
- Dollar Sales: -7% $227M in August ‘18 from $243M in August ‘17
- Inventory Active Listings: -19% (239) in August ‘18 from (298) in August ‘17
Aspen Single family home sales August 2018
- Unit Sales: -71% (4) in August ‘18 from (14) in August ‘17
- Dollar Sales: -83% $20M in August ‘18 from $117M in August ‘17
- Inventory Active Listings: +1% (188) in August ‘18 from (186) in August ‘17
Aspen Single family home sales YTD
- Unit Sales: -43% (43) in August ‘18 from (76) in August ‘17
- Dollar Sales: -46% $298M in August ‘18 from $556M in August ‘17
- Inventory Active Listings: -3% (268) in August ‘18 from (277) in August ‘17
* Typically, the Aspen market represents 70-75% of the total combined Aspen Snowmass Village real estate marketplace.
August 2018 Market Statistics Summary for Snowmass Village Only
Snowmass Village condo sales August 2018
- Unit Sales: +45% (16) in August ‘18 from (11) in August ‘17
- Dollar Sales: +5% $11M in August ‘18 from $11M in August ‘17
- Inventory Active Listings: +10% (168) in August ‘18 from (153) in August ‘17
Snowmass Village condo sales YTD
- Unit Sales: +30% (73) in August ‘18 from (56) in August ‘17
- Dollar Sales: +2% $59M in August ‘18 from $58M in August ‘17
- Inventory Active Listings: +17% (286) in August ‘18 from (244) in August ‘17
Snowmass Village Single family home sales August 2018
- Unit Sales: -75% (1) in August ‘18 from (4) in August ‘17
- Dollar Sales: +8% $9M in August ‘18 from $8M in August ‘17
- Inventory Active Listings: -6% (88) in August ‘18 from (94) in August ‘17
Snowmass Village Single family home sales YTD
- Unit Sales: +13% (27) in August ‘18 from (24) in August ‘17
- Dollar Sales: 5% $88M in August ‘18 from $83M in August ‘17
- Inventory Active Listings: +3% (128) in August ‘18 from (124) in August ‘17
* Typically, the Snowmass Village market represents 25-30% of the total combined Aspen Snowmass Village real estate marketplace.
Links to Aug 2018 Aspen and Snowmass Village Sold Property Photos and Details
Aspen August 2018 Closed Properties (13). This link is valid until 9/30/2018.
Snowmass Village August 2018 Closed Properties (17). This link is valid until 9/30/2018.
Vacant Lots August 2018 Closed Properties (8). This link is valid until 9/30/2018.
___________________
