

Released 09/09/16. Click images for detailed 10-pg Aspen Snowmass Real Estate Market Snapshots
Estin Report:August 2016
Aspen Snowmass Market Snapshot v2.0
Estin Report:Summer 2016
Aspen Snowmass Market Snapshot v5.0
Summer 2016
(June, July, August combined)
BOTTOM LINE: AUGUST AND SUMMER 2016
August 2016 was another dramatically down sales month for Aspen Snowmass real estate compared to same time last year. And the entire summer season – June, July and August 2016 combined – was off similarly.
Aspen single family home (SFH) unit sales especially suffered. They were down -55% to 5 sales in Aug 16 from 11 the same time last year, and down year-to-date (YTD) -64% to 22 sales in 2016 YTD from 61 in 2015 YTD. Dollar sales are off in almost the exact same percentages in Aug 2016 and for YTD 2016. Unit sales are the preferred metric indicating market activity and direction.
Even Aspen’s most resilient neighborhoods were down, off -50% this summer 2016. The West End was down to 3 sales this summer from 6 last summer, and Red Mountain was down to 1 sale this summer from 2 last summer. (See Pgs 7 and 9 Sales by Neighborhoods).
All other Aspen neighborhoods have experienced huge sales fall-offs with one exception: the Aspen Core (Downtown) – the strongest neighborhood as usual – had 18 sales in Aug 16 versus 20 last Aug, off ‘just’ -10%. All of these sales were condos and townhomes; there were no single family home sales.
And as unit sales fall across Aspen neighborhoods, the inventory of active listings is increasing. For Aspen single family homes, inventory increased +6% in Aug 16 and +3% in summer 2016 from the same periods a year ago; for Aspen condos/townhomes, inventory increased 6% in Aug 16 and +33% in summer 2016 over same times last year.
Yes. Prices have started to come down – either upfront in the form of seasonal downward price decreases as sellers want to unload heading into the winter, or on the negotiating end with sellers willing to give up more from their ask prices.
The result is that in most cases, the buyer is paying less.
The biggest single factor responsible for Aspen real estate’s 2016 downturn continues to be the dearth of over $10M residential sales.
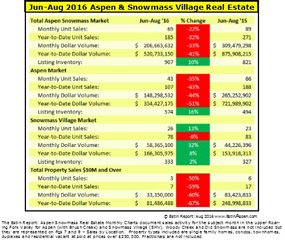
In summer 2016, the $10M and over residential unit sales were off -40% to 3 sales from 5 in summer 2015; dollar volume was off -60% to $33M this summer from $88M last summer.
For YTD, over $10M residential unit sales were off -59% to 7 sales versus 17 in 2015 YTD; dollar volume was off -67% to $82M from $249M in 2015 YTD.
And the lock stock and trade of Aspen real estate sales – homes priced between $2.5M – $7.5M – have fallen off a cliff. In summer 16, there was 1 sale vs 16 last summer.
ASPEN SINGLE FAMILY HOMES SALES BY PRICE POINT
Summer 2016 vs 2015 Summer
Sold Price Unit Sales % Chg Unit Sales
$10M 3 -40% 5
7.5-10M 5 0% 5
5-7.5 0 -100% 9
2.5 – 5 1 -86% 7
1.5 – 2.5 1 100% 0
YTD 2016 YTD 2015
Sold Price Unit Sales Chg % Unit Sales
$10M+ 5 -64% 14
7.5-10M 6 0% 6
5-7.5M 3 -80% 15
2.5-5M 6 -73% 22
1.5-2.5M 0 -100% 3
KEY METRICS – SUMMARY STATS
Here are key metrics for Aspen and Snowmass Village with three different time periods: Aug 2016, Summer 2016 (June, July and August combined), 2016 YTD (Jan 1-Aug 31st):
ASPEN
Aspen total summer unit sales were off -35% to 43 in summer 2016 from 66 last summer.
Aspen total summer dollar sales were off -44% to $148.3M from $265.3M last summer.
The average sales price of an Aspen home in the summer of 2016 was $6.9M versus $7.05M same time last year. The median price skyrocketed 45% summer 2016 to $9.4M from $6.5M last year. Why? Of the 12 homes sold in the summer 2016, 8 were in the range of $7M-$12.5M. The median figure is considered the more reliable as averages are skewed disproportionately by extreme high or low priced sales.
Year to Date (YTD) 2016 through August, the Aspen market alone is down -43% in unit sales to 107 in 2016 YTD from 188 in 2015 YTD. It is down -43% in dollar sales to $354M from $722M last year.
ASPEN SINGLE FAMILY HOMES
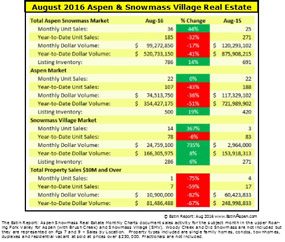
Aug 2016 Aspen single family home activity:
• Unit sales: 5 sales in Aug 16 vs 11 last year, -55%
• Dollar sales: $42M in Aug 16 vs $101M last year, -64%
• Median price: $9,400,000 in Aug 2016 vs $9,000,000 last year, +4%
• Average price per Sq Ft: $1,593 sq ft in Aug 2016 vs $1,826, -13%
• Inventory of active listings: 199 Listing in Aug 2016 vs 187 last year, +6%
Summer (June, July, August combined) 2016 Aspen single family home activity:
• Unit sales: 9 sales in summer 2016 vs 25 last year, -64%
• Dollar sales: $73M in summer 2016 vs $183M last year, -60%
• Median price: $9,400,000 in summer 2016 vs $6,500,000 last year, +45%
• Average price per Sq Ft: $1,358 sq ft in Aug 2016 vs $1,618, -16%
• Inventory of active listings: 223 in summer 2016 vs 216 last year, +3%
YTD 2016 Aspen single family home activity:
• Unit sales: 22 sales in YTD 2016 vs 61 last year, -64%
• Dollar Sales: $153M through Aug 31 vs $426M last YTD, -64%
ASPEN CONDOS/TOWNHOMES
Aug 2016 Aspen condo/townhome activity:
• Unit sales: 17 sales in Aug 16 vs 11 last year, 55%
• Dollar sales: $32M in Aug 16 vs $16M last year, 101%
• Median Price: $1,235,750 in Aug 2016 vs $1,492,500 last year, -17%
• Avg Price per Sq F: $1,275 sq ft in Aug 2016 vs $1,247 last year, +2%
• Listing Inventory of Active Listings: 238 in Aug 2016 vs 187 last year, 6%
Summer (June, July, August combined) 2016 Aspen condo/townhome activity:
• Unit Sales: 31 sales in summer 2016 vs 36 last year, -14%
• Dollar Sales: $60M in summer 2016 vs $61M last year, +1%
• Median Price in summer 2016 was $1,235,750 vs $1,100,000 last year, +12%
• Average Price per Sq Ft: $1,255 sq ft in summer 2016 was vs $979, +28%
• Listing Inventory of Active Listings: 284 in summer 2016 vs 213 last year, +33%
2016 YTD Aspen condo/townhome activity (Jan 1st – Aug 31st):
• Unit Sales: 78 sales in 2016 YTD vs 107 last year, -27%
• Dollar Sales: $168M in 2016 YTD vs $213M last YTD, -64
SNOWMASS VILLAGE (SMV)
Snowmass Village (SMV) numbers are more positive than Aspen’s but SMV accounts for only 20-30% of the total market sales. SMV is doing well compared to Aspen due to the huge discount that it is selling at. – pre-Crisis, the historical SMV discount had been 25-30% off Aspen prices, it is now 50%.
SMV total summer 2016 unit sales were up 13% to 26 sales from 23 last summer; total dollar sales were up 32% to $58M from $44M last summer.
Year to Date SMV unit sales are down -6% to 78 from 83 in 2015 YTD; dollar sales are up 8% to $106M from $154M in 2015 YTD.
Snowmass Village sellers are in a stronger position than Aspen’s to resist discounting and fight for every dollar…their relatively low prices have finally done what they’re supposed to – bring on the buyers.
SMV SINGLE FAMILY HOMES
Aug 2016 SMV single family home activity:
• Unit sales: 5 sales in Aug 16 vs 1 in Aug last year, +400%
• Dollar sales: $17M in Aug 16 vs $2M in Aug last year, +832%
• Median price: $1,235,000 in Aug 2016 vs $1,100,00 in Aug last year, +12S%
• Average price per Sq Ft: $770 sq ft in Aug 2016 vs $722 in Aug last year, +7%
• Inventory of active listings: 72 listings in Aug 2016 vs 67 in Aug last year, +7%
Summer (June, July, August combined) 2016 SMV single family home activity:
• Unit sales: 13 sales in summer 2016 vs 7 in summer last year, +86%
• Dollar sales: $43M in summer 2016 vs $32M in summer last year, +38%
• Median price: $2,876,000 in summer 2016 vs $4,250,000 in summer last year, -32%
• Average price per Sq Ft: $826 sq ft in Aug 2016 vs $1,095 in summer last year, -25%
• Inventory of active listings: 223 in summer 2016 vs 220 in summer last year, +1%
YTD 2016 SMV single family home activity:
• Unit sales: 28 sales in YTD 2016 vs 19 last year-to-date +47%
• Dollar Sales: $112M YTD 2016 vs $87M last year-to-date, +28%
SMV CONDOS/TOWNHOMES
Aug 2016 SMV condo/townhome activity:
• Unit sales: 12 sales in Aug 16 vs 14 in Aug last year, -14%
• Dollar sales: $12M in Aug 16 vs $10M in Aug last year, +31%
• Median price: $1,235,000 in Aug 2016 vs $1,100,00 in Aug last year, +12S%
• Average price per Sq Ft: $770 sq ft in Aug 2016 vs $722 in Aug last year, +7%
• Inventory of active listings: 194 listings in Aug 2016 vs 183 in Aug last year, +6%
Summer (June, July, August combined) 2016 SMV condo/townhome activity:
• Unit sales: 12 sales in summer 2016 vs 14 in summer last year, -14%
• Dollar sales: $12M in summer 2016 vs $10M in summer last year, +31%
• Median price: $925,000 in summer 2016 vs $606,448 in summer last year, +53%
• Average price per Sq Ft: $671 sq ft in Aug 2016 vs $587 in summer last year, -14%
• Inventory of active listings: 223 in summer 2016 vs 220 in summer last year, +1%
YTD 2016 SMV condo/townhome activity:
• Unit sales: 46 sales in YTD 2016 vs 60 last year-to-date +23%
• Dollar Sales: $46M YTD 2016 vs $62M last year-to-date, -25%
FUTURE ACTIVITY
The number of pending/under contract properties is seen as a future indicator of closings and activity. In Aug 16, there were 42 properties under contract versus 47 same time last year, down -11%.
Given the uncertainty of the US election and the news cycle’s obsession with it, it would be wishful thinking to speculate that the market will improve much through the remainder of the year.
Except, as August figures demonstrate, the well documented weakness in the market is bringing out buyers, and, one assumes, sellers will be more reasoned and motivated to make deals.
We are likely to see the typical September early fall seasonal uptick in sales activity as buyers who have been looking during the summer make their moves to secure properties in order to be settled before the Holidays and winter. Additionally, sellers are more motivated in the fall not wishing to hang onto properties heading into the winter.
But this is unlikely to alter the fact that 2016 market performance continues to disappoint all except serious buyers. For them, it should be hot-diggity, giddy-up, let’s go.
Whether 2016 is the turning point for a continuing downward market or a base from which to climb out of remains to be seen.
Disclaimer: The statements made in The Estin Report and on Aspen broker Tim Estin’s blog represent the opinions of the author and should not be relied upon exclusively to make real estate decisions. They do not represent the opinions or statements of Aspen Snowmass Sothebys International Real Estate. A potential buyer and/or seller is advised to make an independent investigation of the market and of each property before deciding to purchase or to sell. To the extent the statements made herein report facts or conclusions taken from other sources, the information is believed by the author to be reliable, however, the author makes no guarantee concerning the accuracy of the facts and conclusions reported herein. Information concerning particular real estate opportunities can be requested from Tim Estin at970.309.6163or by email. The Estin Report is copyrighted 2016 and all rights reserved. Use is permitted subject to the following attribution with a live link to the source: “The Estin Reporton Aspen Real Estate.”
______________________________
