

Released Dec 6, 2017 v2.0
Nov 2017
Aspen and Snowmass Village
Real Estate Snapshot
(Click images above for full 10 Pg Snapshot PDF with detailed charts and tables for Aspen and Snowmass Village
real estate sales and sales by neighborhoods.)
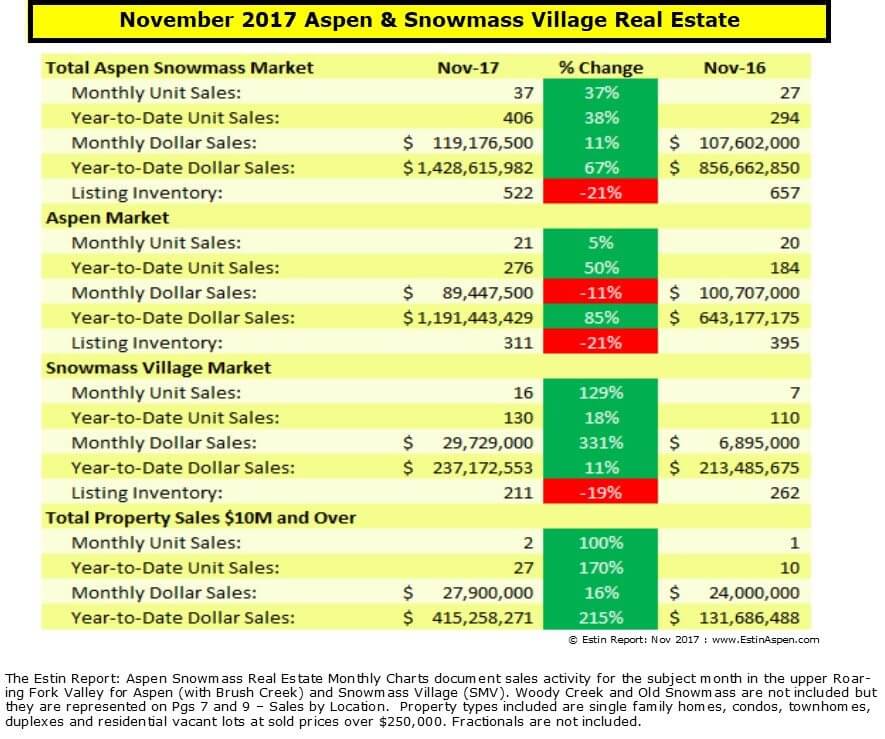
Bottom Line
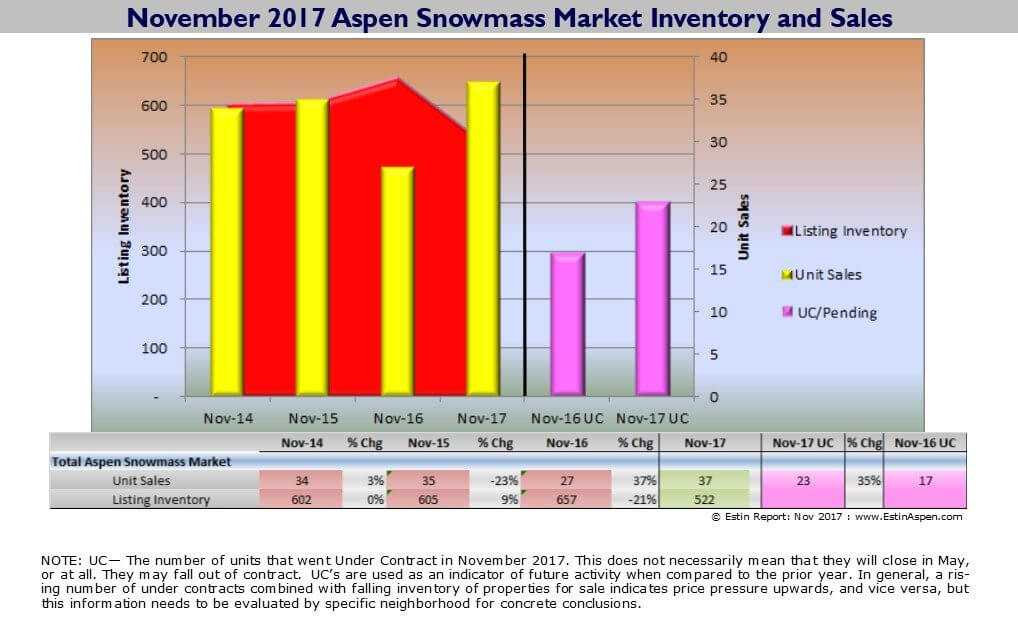
Nov 2017 continues the strong performance we’ve experienced throughout the year. We are close to beating the record year 2015.
Standout categories for the month of November are:
1) Aspen condo sales up 31% YTD while inventory of available listings is off -29%. In the 3-mos sales period from Sep-Nov 17, the avg condo/townhome sold at $1,731 sq ft over $1,346 in the same period Nov 2016, +29%.
2) Value outside Aspen Core: an example of excellent values away from the Aspen Core, Starwood had (3) sales Sep-Nov 17 at an avg $610 sq ft vs $830 sq ft same period a year ago, -26%. The caveat: these sales were for older homes selling essentially at lot value, but for reference, compare this to the avg. (3) downtown SF home sale at $2,227 sq ft in the same period.
3) Snowmass Village values: SMV has been very active in Nov 17 with (16) sales vs (7) last year, +129%; dollar sales even better – $29.7M vs $6.9M, +331%. Of (4) Ridge Run SFH sales Sep-Nov 17, the avg sale was $635 sq ft vs $1,095 same period last year. SMV opportunities continue…in general, prices are similar, if not down incrementally, from last year.
Deep Dive: Sales by Location
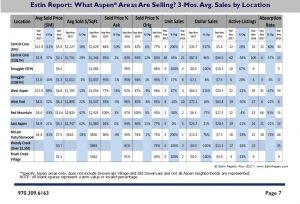
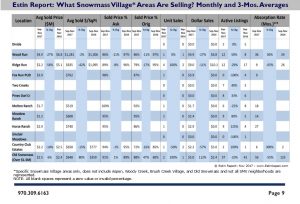
Aspen Sales by Neighborhood Snowmass Village Sales by Neighborhood
November 2017 Market Statistics Summary for Aspen Only *
Aspen condo sales November 2017
Unit Sales: +10% (11) in November ‘17 from (10) in November ‘16
Dollar Sales: +18% $25M in November ‘17 from $21M in November ‘16
Inventory Active Listings: -29% (115) in November ‘17 from (162) in November ‘16
Aspen condo sales YTD
Unit Sales: +31% (160) in November ‘17 from (122) in November ‘16
Dollar Sales: +44% $368M in November ‘17 from $255M in November ‘16
Inventory Active Listings: -18% (345) in November ‘17 from (406) in November ‘16
Aspen Single family home sales November 2016
Unit Sales: -11% (8) in November ‘17 from (9) in November ‘16
Dollar Sales: -7% $57M in November ‘17 from $61M in November ‘16
Inventory Active Listings: -11% (152) in November ‘17 from (171) in November ‘16
Aspen Single family home sales YTD
Unit Sales: +102% (101) in November ‘17 from (50) in November ‘16
Dollar Sales: +143% $764M in November ‘17 from $314M in November ‘16
Inventory Active Listings: +5% (321) in November ‘17 from (305) in November ‘16
*Typically, the Aspen market represents 70-75% of the total combined Aspen Snowmass Village real estate marketplace.
Links to November 2017 Aspen and Snowmass Village Sold Property Photos and Details
Aspen Nov 2017 Closed Properties (19). This link is valid until 1/1/2018.
Snowmass Village Nov 2017 Closed Properties (15). This link is valid until 1/1/2018.
Vacant Lots Nov 2017 Closed Properties (3). This link is valid until 1/1/2018.
