

Released April 7, 2019 on or near the 1st Mon. of each month. v1.8. Rev 04/15/19
Bottom Line
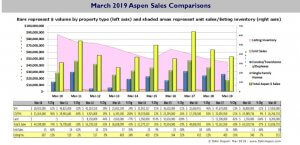
The market uncertainty that prevailed in Dec – Jan 2019 has eased, and the financial markets and confidence has returned. Aspen sales in March have been very active and news is positive. There are terrific opportunities outside of the downtown Core, but the Core is premium priced and appreciating faster and better than anywhere else – the recession downturn proved the Core’s liquidity, $$ appreciation proclivity and desirability over all other area in Aspen, with the West End and Red Mountain coming in 2nd place.
Rev 04/15/19: For Q1 2019, Aspen and separately Snowmass overall units sales are -4% and -33% respectively from Q1 2018; overall dollar sales are -7% and +50% respectively. (Snowmass had two single family home sales at $14.3M and $8.6M which spiked their dollar sales for the quarter.)
March unit sales for Aspen are up +68%, (18) vs (11), and under contracts are up +158%, (31) vs (12) compared to the same time last year. (Under contracts are used as an indicator of future activity.)
More specifically, in March, Aspen condo sales were up 140% year over year, (12) in Mar 19 vs (5) in Mar 2018 and Aspen condo inventory is super low, down 28% from peak year Mar 2017, pressuring prices upwards.
In the past 6 mos., the average 2 Bdrm Aspen condo price was $1.64M/$1,710 sf vs $1.24M/$1,260 sf a year ago (See Pg 7).
And Aspen inventory in general is down almost 25% from record year March 2017.
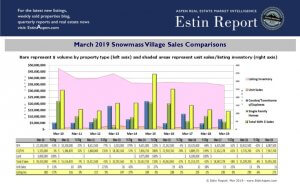
Snowmass Village performance (See Pgs 8 +9), in general – accounting for approximately 25% of the total Aspen Snowmass market – is about even with last year.
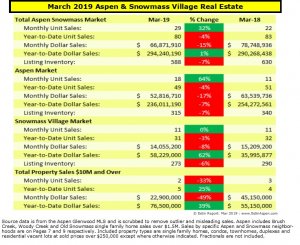
March 2019 Aspen Real Estate Market Summary for Aspen Only*
Aspen condo sales March 2019
- Unit Sales: +140% (12) in March ‘19 from (5) in March ‘18
- Dollar Sales: +9% $27M in March ‘19 from $24M in March ‘18
- Inventory Active Listings: -1% (128) in March ‘19 from (129) in March ‘18
Aspen condo sales Year-to-Date YTD = Q1 2019 (Jan 1- Mar 31st)
- Unit Sales: -7% (28) in March ‘19 from (30) in March ‘18
- Dollar Sales: -33% $75M in March ‘19 from $112M in March ‘18
- Inventory Active Listings: +7% (161) in March ‘19 from (150) in March ‘18
Aspen Single family home sales March 2019
- Unit Sales: -20% (4) in March ‘19 from (5) in March ‘18
- Dollar Sales: -51% $18M in March ‘19 from $37M in March ‘18
- Inventory Active Listings: -3% (153) in March ‘19 from (158) in March ‘18
Aspen Single family home sales YTD = Q1 2019 (Jan 1- Mar 31st)
- Unit Sales: -11% (17) in March ‘19 from (19) in March ‘18
- Dollar Sales: -6% $129M in March ‘19 from $138M in March ‘18
- Inventory Active Listings: -3% (174) in March ‘19 from (180) in March ‘18
* Typically, the Aspen market represents 70-75% of the total combined Aspen Snowmass Village real estate marketplace.
Note: Excluded from Mar 2019 market snapshot data as Aspen outlier sales: 350 Eagle Park (auction sale); 46 Lower Hurricane (Mining clain sale); 525 Shield O Terrace (Bank sale).
March 2019 Snowmass Village Real Estate Market Summary*
Snowmass Village condo sales March 2019
- Unit Sales: +29% (9) in March ‘19 from (7) in March ‘18
- Dollar Sales: +67% $8M in March ‘19 from $5M in March ‘18
- Inventory Active Listings: -8% (175) in March ‘19 from (191) in March ‘18
Snowmass Village condo sales Year-to-Date YTD
- Unit Sales: +4% (24) in March ‘19 from (23) in March ‘18
- Dollar Sales: +73% $22M in March ‘19 from $13M in March ‘18
- Inventory Active Listings: -6% (213) in March ‘19 from (229) in March ‘18
Snowmass Village Single family home sales March 2019
- Unit Sales: -50% (2) in March ‘19 from (4) in March ‘18
- Dollar Sales: -42% $6M in March ‘19 from $10M in March ‘18
- Inventory Active Listings: -1% (84) in March ‘19 from (85) in March ‘18
Snowmass Village Single family home sales YTD
- Unit Sales: -33% (6) in March ‘19 from (9) in March ‘18
- Dollar Sales: +50% $35M in March ‘19 from $23M in March ‘18
- Inventory Active Listings: -7% (92) in March ‘19 from (99) in March ‘18
* Typically, the Snowmass Village market represents 25-30% of the total combined Aspen Snowmass Village real estate marketplace.
Note: Excluded as from Mar 2019 market snapshot data as Snowmass Village outlier sales: 90 Edgewood (extreme high price per sq ft sale at $8.65M/$1,893 sq ft.)
LINKS TO MAR 2019 PROPERTY SALES DETAILS AND PHOTOS
ASPEN SALES MAR 2019 – 19 LISTINGS This link is valid until 4/28/2019.
SNOWMASS VILLAGE (SMV) SALES MARCH 2019 – 12 Listings This link is valid until 4/28/2019.
VACANT LOT SALES MAR 2019 – 2 Listings This link is valid until 4/28/2019.
___________________________
