

Released Oct 20, 2019 v2.0 The Estin Report publishes 10-page monthly Aspen real estate market “Snapshot” reports as PDF file on or near the 1st Monday of each month. The Snapshot presents a “bottom line” summary and raw data for the subject month and YTD performance for residential real estate sales in Aspen and Snowmass by overall market(s), 6-mos avgs. sales for different property type and by neighborhood. There are three sections:1) Total combined Aspen Snowmass Village Market; 2) The Aspen Market; 3) The Snowmass Village Market. It features charts, tables and 30-day live links to photos and details of sold properties and compares the subject month to the same time in prior years. The ER Monthly Snapshot is the only Aspen and Snowmass property sales information widely published in a timely and consistent manner early each month.
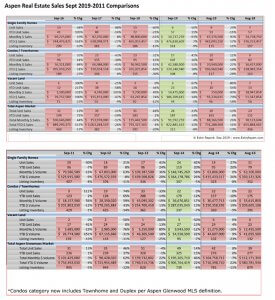
Aspen Real Estate Sales Sept 2011-2019 Comparisons
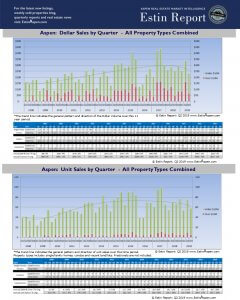
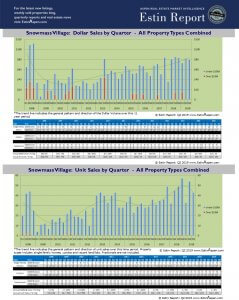
Aspen & Snowmass Village Historic Real Estate Sales Q1 2008-Q3 2019
by totals and property types: SF Homes, Condos/Townhomes and Vacant Land
Bottom Line
Sept 2019 YOY sales are dramatically down over same time last year.
For the month, Aspen single family home unit sales are off 60% over Sep 2018, (6) sales now vs (15) then, and sales for 2019 YTD are down 21%, (51) vs (72) last year. Aspen single family dollar sales are off similarly for Sept 19, but up 3% year to date.
Aspen condo unit sales, much in demand with a very low inventory of active listings, were up 31% in Sept 19, (17) now vs (13) in Sept 18; Sept 19 dollar sales are up 15% YOY but down 10% for 2019 YTD – possibly due to more smaller size units selling .
Snowmass Village metrics are similar to Aspen’s except that SMV is selling at approximately 50% discount to Aspen just 8 miles away.
Where are we now? See Estin Report Charts…trend lines from Q1 2008 through Q3 2019. For 2019, the positive trending areas are Aspen condo unit sales and vacant lot dollar sales: for condos, demand is high, supply limited and prices are high; for vacant land, supply is limited and prices are high but demand is slow.
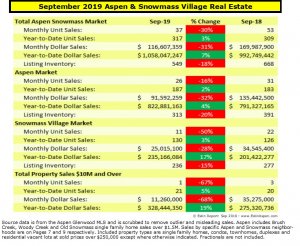
September 2019 Market Statistics Summary for Aspen Only *
Aspen condo sales September 2019
- Unit Sales: +31% (17) in Sep ‘19 from (13) in Sep ‘18
- Dollar Sales: +15% $42M in Sep ‘19 from $37M in Sep ‘18
- Inventory Active Listings: -30% (108) in Sep ‘19 from (155) in Sep ‘18
Aspen condo sales YTD
- Unit Sales: +13% (107) in Sep ‘19 from (95) in Sep ‘18
- Dollar Sales: -10% $239M in Sep ‘19 from $265M in Sep ‘18
- Inventory Active Listings: -7% (254) in Sep ‘19 from (275) in Sep ‘18
Aspen Single family home sales September 2019
- Unit Sales: -60% (6) in Sep ‘19 from (15) in Sep ‘18
- Dollar Sales: -61% $35M in Sep ‘19 from $89M in Sep ‘18
- Inventory Active Listings: -13% (161) in Sep ‘19 from (186) in Sep ‘18
Aspen Single family home sales YTD
- Unit Sales: -21% (57) in Sep ‘19 from (72) in Sep ‘18
- Dollar Sales: +3% $477M in Sep ‘19 from $465M in Sep ‘18
- Inventory Active Listings: -8% (272) in Sep ‘19 from (298) in Sep ‘18
Notes:
*Typically, the Aspen market represents 70-75% of the total combined Aspen Snowmass Village real estate marketplace. Active Inventory Aug 2019 is all the actives in August 2019; active inventory YTD is all actives through August of 2019 (Jan 2019 – Aug 2019).
Sept 2019 Outlier Sales:
September 2019 Market Statistics Summary for Snowmass Village Only
Snowmass Village condo sales September 2019
- Unit Sales: -43% (8) in Sep ‘19 from (14) in Sep ‘18
- Dollar Sales: -34% $8M in Sep ‘19 from $12M in Sep ‘18
- Inventory Active Listings: -10% (157) in Sep ‘19 from (174) in Sep ‘18
Snowmass Village condo sales YTD
- Unit Sales: +7% (93) in Sep ‘19 from (87) in Sep ‘18
- Dollar Sales: +33% $95M in Sep ‘19 from $71M in Sep ‘18
- Inventory Active Listings: -3% (309) in Sep ‘19 from (321) in Sep ‘18
Snowmass Village Single family home sales September 2019
- Unit Sales: -67% (2) in Sep ‘19 from (6) in Sep ‘18
- Dollar Sales: -25% $15M in Sep ‘19 from $20M in Sep ‘18
- Inventory Active Listings: -21% (70) in Sep ‘19 from (89) in Sep ‘18
Snowmass Village Single family home sales YTD
- Unit Sales: 0% (34) in Sep ‘19 from (34) in Sep ‘18
- Dollar Sales: +24% $137M in Sep ‘19 from $111M in Sep ‘18
- Inventory Active Listings: -6% (137) in Sep ‘19 from (146) in Sep ‘18
Notes:
* Typically, the Snowmass Village market represents 25-30% of the total combined Aspen Snowmass Village real estate marketplace.
Active Inventory Aug 2019 is all the actives in August 2019. Active inventory YTD is all actives through August of 2019 (Jan 2019 – Aug 2019).
Links to Sep 2019 Aspen and Snowmass Village Sold Property Photos and Details
Aspen Sep 2019 Closed Properties (25). This link is valid until 10/28/2019.
Snowmass Village Sep 2019 Closed Properties (11). This link is valid until 10/28/2019
Vacant Lots Sep 19 Closed Properties (1). This link is valid until 10/28/2019.
