

Released Mar 8, 2019 v2.0
Click images to enlarge
Bottom Line
Yes, we may be experiencing some market weakness, but the same thing could be said in Jan/Feb 2015 and Jan/Feb 2017 which both turned out to be record sales years of the past ten. The early winter months, Jan – Mar, are typically slower, picking up in Apr and May, slower in June/July and then picking up in Aug for the rest of the year (See Pg 5 Historical sales).
Aspen 2019 Year to Date (YTD) through Feb 28th:
- Aspen condo market is down -36% in unit sales, (16) in 2019 vs (25) in 2018, and dollar sales are down -44%, $48M vs $87M
- Aspen single family homes unit sales are down -7%, (13) vs (14) last year, and dollar sales are up 10%, $111M now vs $101M then.
Snowmass Village (SMV) 2019 YTD
- SMV condo market is down -6% in unit sales, (15) in 2019 vs (16) in 2018, and dollar sales are up 77%, $13.8M vs $7.8M
- SMV single family homes unit sales are down -20$%, (4) vs (5) last year, and dollar sales are up 124%, $29.2MM now vs $13M then.
Anecdotally, brokers are sensing softness in the Aspen market. Reasons:
- Feb ’19 was the 2nd highest in Aspen dollar sales since Feb ’12, while unit sales were the slowest since then.
- Recession concerns cause uncertainty and with uncertainty, urgency dissipates and decisions are postponed.
- Aspen Core condo inventory of active listings has declined significantly (see Pg 2, Inventory & Sales) which translates into fewer choices and higher prices …this is a micro market. It’s a function of supply/demand: fixed supply…there’s never going to be anymore. The Core has proven liquidity; Core was the first to recover; easiest to sell.
- Condos are more attractive buy than a single family home – renovation of a condo is far easier than a house. This may explain some weakness in the single family market.
- Real estate weakness reported on both east and west coast markets. In NYC, there is reported weakness at all price points. Sales of contracts $4M+ fell 16% in the past year. Reasons? 1) Construction boom and an over supply of new units flooding the market 2) Tax bill at end of 2017 reducing real estate deductions; 3) Uncertainty…recession worries deplete a sense of urgency translating into the fact that sellers might want to consider price reductions to get buyers more motivated.
- In Aspen Jan / Feb 2019 , there have been 4-5 high end, prominent sales above $10M, but these are looking more like outliers, not general market strength endorsements although some may argue as such.
- Global bankers see economic weakness, slowing growth, and interest rates are flat or falling, generally a positive sign for housing.
- Pending outcomes that could change things for positive or negative: Brexit, China trade deal, N. Korea
Bloated Inventory of Expensive Homes for Sale
For Aspen Snowmass single family homes asking $10M and over, there are currently (93) active listings – of those, (4) are under contract and there have been (22) sales, or 24%, in the past year.
The absorption rate (the average length of time to sell) for properties priced $10M+ = 22 sales /12 mos = 1.83 sales per mos; 93 units active inventory /1.83 rate = 51 months to sell . That is a long time on market, many sellers ask why their property hasn’t sold – in general, prices are exceedingly high, there is bloated inventory of very expensive, over-priced homes. Easily said, much harder to do but there is nothing like a price-reduction to fix a property that isn’t selling.
Snowmass is a different story with a lot of positive sentiment…There’s new condo inventory released in 2018 and good buzz as the Base Village nears construction completion. As one broker said, “There’s finally a sense of being, of a place to be, out there..”
Under Contracts/Pendings as a future indicator
- Aspen under contracts/pending properties in Feb – which will typically close in March or April – is down -100% (24) in 2019 vs (12) in 2018.
- Snowmass Village under contracts are up 47% in Feb, (22) in 2019 vs (15) in 2018.
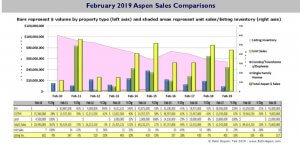
February 2019 Market Statistics Summary for Aspen Only *
Aspen condo sales February 2019
- Unit Sales: -60% (4) in February ‘19 from (10) in February ‘18
- Dollar Sales: -50% $10M in February ‘19 from $20M in February ‘18
- Inventory Active Listings: +7% (129) in February ‘19 from (121) in February ‘18
Aspen condo sales YTD
- Unit Sales: -36% (16) in February ‘19 from (25) in February ‘18
- Dollar Sales: -44% $48M in February ‘19 from $87M in February ‘18
- Inventory Active Listings: +5% (142) in February ‘19 from (135) in February ‘18
Aspen Single family home sales February 2019
- Unit Sales: -17% (5) in February ‘19 from (6) in February ‘18
- Dollar Sales: -31% $45M in February ‘19 from $65M in February ‘18
- Inventory Active Listings: -6% (153) in February ‘19 from (163) in February ‘18
Aspen Single family home sales YTD
- Unit Sales: -7% (13) in February ‘19 from (14) in February ‘18
- Dollar Sales: +10% $111M in February ‘19 from $101M in February ‘18
- Inventory Active Listings: -5% (164) in February ‘19 from (174) in February ‘18
* Typically, the Aspen market represents 70-75% of the total combined Aspen Snowmass Village real estate marketplace.
For Aspen stats, the following property has been “scrubbed” from the Feb ’19 data throughout this market snapshot as an outlier – disproportionately skewing the the averages. MLS # 157975, An Aspen 1/2 duplex at 980 King Street Unit 1, sold at land value $2.3M/$2,340 sq ft (1963 built 1/2 duplex, 2 bdrm/1 ba, 983 sq ft in the Smuggler area of Aspen).
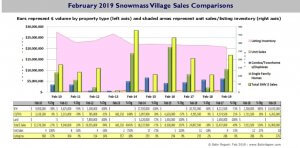
February 2019 Market Statistics Summary for Snowmass Village Only
Snowmass Village condo sales February 2019
- Unit Sales: -27% (8) in February ‘19 from (11) in February ‘18
- Dollar Sales: +10% $6M in February ‘19 from $6M in February ‘18
- Inventory Active Listings: -9% (178) in February ‘19 from (195) in February ‘18
Snowmass Village condo sales YTD
- Unit Sales: -6% (15) in February ‘19 from (16) in February ‘18
- Dollar Sales: +77% $14M in February ‘19 from $8M in February ‘18
- Inventory Active Listings: -12% (220) in February ‘19 from (193) in February ‘18
Snowmass Village Single family home sales February 2019
- Unit Sales: +100% (2) in February ‘19 from (1) in February ‘18
- Dollar Sales: +383% $11M in February ‘19 from $2M in February ‘18
- Inventory Active Listings: +8% (84) in February ‘19 from (78) in February ‘18
Snowmass Village Single family home sales YTD
- Unit Sales: -20% (4) in February ‘19 from (5) in February ‘18
- Dollar Sales: +124% $29M in February ‘19 from $13M in February ‘18
- Inventory Active Listings: +3% (86) in February ‘19 from (89) in February ‘18
* Typically, the Snowmass Village market represents 25-30% of the total combined Aspen Snowmass Village real estate marketplace.
For Snowmass Village stats, the following property has been “scrubbed” from the Feb ’19 data throughout this market snapshot as an outlier – where extreme high or low sales will disproportionately affect the averages.: MLS # 152217, SMV Condo Penthouse “Lumin Penthouse” Condo – a 2018 built pre-eminent Base Village Penthouse that sold in Jan for $6.1M/$1,857 sq ft for 4 bdrm/4.5 ba, 3,384 sq ft unit.
Links to Feb 2019 Aspen and Snowmass Village Sold Property Photos and Details
Aspen Feb 2019 Closed Properties (9). This link is valid until 4/28/2019.
Snowmass Village Jan 2019 Closed Properties (10). This link is valid until 4/28/2019
Vacant Lots Jan 19 Closed Properties (1). This link is valid until 4/28/2019.
