
Click image for full report and charts. Summary is below.
Click image for full report and charts. Summary is below.(v18)
About this Report
The Estin Report on Aspen Snowmass real estate encompasses sales and market activity activity for the upper Roaring Fork Valley – Aspen, Snowmass Village, Woody Creek and Old Snowmass – during 1st and 2nd Quarters 2011 and 1st Half 2011. Included property types are single family homes, condos, townhomes, duplexes and residential vacant land at sold at prices over $250,000. Fractionals are not included. The report compares the 1st half of 2011 to the 1st half of 2010, historical first half of the year comparisons since 2004 and prior quarter and prior year quarter comparisons. The source data is the Aspen/Glenwood MLS.
Disclaimer: The statements made in The Estin Report and on Tim Estin’s blog represent the opinions of the author and should not be relied upon exclusively to make real estate decisions. A potential buyer and/or seller is advised to make an independent investigation of the market and of each property before deciding to purchase or to sell. To the extent the statements made herein report facts or conclusions taken from other sources, the information is believed by the author to be reliable, however, the author makes no guarantee concerning the accuracy of the facts and conclusions reported herein. Information concerning particular real estate opportunities can be requested from Tim Estin at 970.920.7387 or by email. The Estin Report is copyrighted 2011 and all rights reserved. Use is permitted subject to the following attribution: “The Estin Report: State of the Aspen Market, By Aspen broker Tim Estin, mba, gri, www.EstinAspen.com”
________________________________________________________________________
1st Half 2011 Market Overview
The 1st Half 2011 shows a dramatic increase in Aspen Snowmass real estate activity year over year. Sales performance for the first half of this year continues to substantiate the very positive trend of increased sales across the board. In general, market prices have reset to a post-crisis level, off on average 25-40% from the market peak, but much depends on the property, unique circumstances and seller motivation. Prices continue to be under at least incremental pressure assuming they are at the “new norms” and deal-making and haggling are a dominant part of the transactional process. It’s not pleasant but it is business as usual these days.
Aspen
The Aspen market has turned most significantly in the central Aspen core and West End and expanding outwards like ripples in a pond.Specifically:
- The ultra luxury Aspen home market – properties closing over $10M – is up 175% (11 sales) in 1H 2011 versus (4) sales in 1H 2010.
- Aspen home sales in 1H 2011 are up 45% in units sold and up 41% in dollar sales over the same period last year;
- Aspen condo sales are up an even more impressive 48% in dollar sales volume and 67% in unit sales.
- In 1H2011, 48% of Aspen home sales sold for less than $4M, whereas in 1H 2010 32% of Aspen home sales were in the under $4M category. This illustrates two points: 1) The fall in prices in past 2 years – what used to cost $5M, now costs $3M-4M; 2) Buyers are in fact stepping up to take advantage of this pricing reset.
Snowmass Village
The Snowmass Village market has performed much better this half year than last, but the environment remains immensely challenging with continued uncertainty caused by the pending Base Village foreclosure sale. Snowmass prices continue to deteriorate with the exception of high end, fantastic ski-in/out properties which are maintaining premium values. Some of the best market values and opportunities are available in Snowmass – uncertainty is opportunity.
- Snowmass condo sales doubled from 16 to 32 (100%) in 1H 2011 year over year and dollar volume increased from $19M to $30M (56%)
- Snowmass single family homes saw double digit growth of 19% in dollar sales ($64M to $80M) and 25% in unit sales (12 to 15 sales) from 1H 2010 to 1H 2011.
Yet even as Aspen and Snowmass Village activity has substantially increased since the “transactional bottom” in the first half of 2009 as evidenced then by the least number of unit sales and lowest dollar sales volume since the Crisis began, it remains unclear the extent to which we have in fact reached a bottoming of prices.
Market Direction
Are we still falling or are we scraping along a bottom? There are a number of reasons for uncertainty.
Ø Continued High Inventory Levels: Even though the inventory of active listings has fallen 23% from its 2009 high, it continues to remain at historically high levels. There still are a lot more properties for sale than buyers, and over supply, under demand translates into price pressure.
Ø Deal Savvy Buyers: While a sense of ‘missing the bottom’ is driving some buyers, others have adopted a ‘wait and see’ attitude. Unless motivated by a property they can’t live without at a price that demonstrates value, most prospective buyers will move on to the next property. Or continue to wait out the market. And even if these buyers get a property under contract, some continue to shop and deals are consistently falling out. Ask a title company: yes, more transaction activity but many don’t close.
ØLurking Shadow Inventory: There are a number of owners pining to sell in the past three years who are waiting for improved market conditions. These properties will “errupt” onto the marketplace as soon as there is a sense of relaxation of downward price pressure – but at the hint of such a relaxation, this pent-up new inventory should emerge onto the market causing renewed pricing competition amongst sellers to start all over again. Think of it literally as ‘waves’ of inventory brought to market by desperate sellers, motivated sellers, bank short sales, foreclosures….continuing to pressure the many otherwise healthy, less needy sellers. Price ‘relaxation’ is unlikely to occur in my estimation for at least in the next 6-12 months, if not longer, until inventory levels subside. Those Aspen prognosticators who hype otherwise are misleading their public.
Ø Save and Build Option: Anything brand new in Aspen’s Core and West End is selling well and at strong premium pricing. The average and median prices of residential vacant lots have fallen to 60-70% discounts from a year ago (see Pg 6 vacant land). A large number of these sales are highly motivated and/or distressed sales (rev. 07/14/11 8:27AM). Intuitively, my gut says land discounts are closer to 45% – 55%. In many cases now, it should be cheaper to buy land and build with construction costs down 20-30% if not more than purchase an existing home.Yes, the Pitkin County approval process is arduous but it is far more expedient now than in the boom days; and as so little new construction is taking place at present due to impossible financing conditions, by the time one completes the job in 2-3 years, there should be substantial demand for this premium priced product as such limited new supply will then be available.
Ø Uncertain US Economic Picture: The most recent early July 2011 job numbers confirm the fragility of this recovery and taunting increase of oil prices impact everything.
Ø Global Economic Volatility: There are the known events, Greece and euro-contagion, and then there are unforeseen events such as the Japanese earthquake that have created and reinforced an overall sense of fragility and lack of optimistic conviction. . This is not doomsday thinking, it is the 21st Century world in which we now live.
Much of Aspen real estate activity is fed by our sense of well-being. If the stock market is up, it is likely that the local real estate market will mirror that and the converse applies as well. Yes, we are a small mountain hamlet, but we all are connected now, and Aspen’s gold-leafed immunity has disappeared in the G5 age.
So. The critical question …
Has the market turned?
Yes, in that real estate activity has significantly picked up and has returned to a more “normal” pre-2005-2008 pace.
No, because while the rate of price discounting appears to have stabilized, there continues to be extraordinary pressure on sellers to further reduce – even if incrementally – in order to get the deal done if one truly wants or needs to sell. If not, one is best advised to not list one’s property. It is a brutal experience for sellers.
The strongest selling geographic areas and product categories are: Aspen Core, the West End, Snowmass slope side ski-in/out;the strongest property types selling are: new construction homes and condos in Core and West End,large uniquely built homes whose size, quality and location are not easily reproduced, properties priced “to market” and highly discounted vacant lots in good to great locations.
Key Findings 1H 2011
Aspen
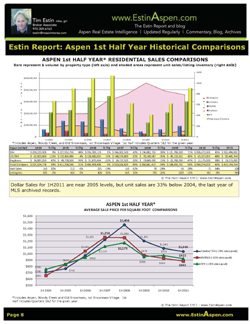
·Dollar Sales for 1H2011 are near 2005 levels, but unit sales are 33% below 2004, the last year of MLS archived records. As a point of reference, the Aspen real estate market began its pre-boom climb in Feb 2004 after a long post 9/11 lull.
· In 1H 2011, since the half year market peak in 2007-2008, the average price per sq ft is down 21% for Aspen single family homes and 29% for condos/townhomes
· Aspen home sales in 1H 2011 are up 45% in units sold and up 41% in dollar sales over the same period last year; Aspen condo sales are up an even more impressive 48% in dollar sales volume and 67% in unit sales.
·In 1H2011, 48% of Aspen home sales sold for less than $4M, whereas in 1H 2010 32% of Aspen home sales were in the under $4M category. This illustrates two points: 1) The fall in prices in past 2 years – what used to cost $5M, now costs $3M-4M; 2) Buyers are in fact stepping up to take advantage of this pricing reset.
· The ultra luxury Aspen home market – properties closing over $10M – is up 175% (11 sales) in 1H 2011 versus (4) sales in 1H 2010.
· From 1Q to 2Q 2011, Aspen unit sales and dollar volume are strikingly similar indicating little growth – or momentum – in the marketplace from this winter to now.
· In 2Q 2011, the West End and Central Core account for 50% unit sales and 43% dollar volume of all Aspen single family home sales – solid proof of just how desirable in-town properties are.
Snowmass Village
·In 1H 2011, since the half year market peak in 2007-2008. the average price per sq ft for both Snowmass Village single family homes and condos is down 60% for each property type.
·There is significant improvement in the Snowmass Village market compared to a year ago:
- Snowmass condo sales of Snowmass doubled from 16 to 32 (100%) in 1H 2011 year over year and dollar volume increased from $19M to $30M (56%)
- Snowmass single family homes saw double digit growth of 19% in dollar sales ($64M to $80M) and 25% in unit sales (12 to 15 sales) from 1H 2010 to 1H 2011.
· From 1H2010 to 1H2011, the median price of Snowmass homes has dropped 36% and the average days on market has increased 32%. As ultra high end sales tend to skew average sales price data disproportionately higher, median pricing statistics provide a more accurate measure of pricing trends.
·In 1H 2011, sales of Snowmass homes under $4M accounted for 67% (10), or 2/3, of the total sold (15) and 27% of total dollar volume, whereas in 1H 2010, under $4M homes accounted for 25% (4) of the total homes sold (12) and 17% of total dollar volume. This indicates a significant market shift downward in values, yet as prices fall, home purchases are in fact picking up.
Residential Vacant Land
The average and median prices of residential vacant lots have fallen 60-70% from a year ago (see Pg 7 vacant land) even though a large number of these sales were distressed and/or highly motivated. Intuitively, my gut says land discounts are realistically closer to 45-55%, but the numbers are what they are. In many cases now, it should be cheaper to buy land and build with construction costs down 20-30% than to purchase an existing home.
Table of Contents
Map of Targeted Areas and Key Findings…………………………… Page 6
Aspen Snowmass Market Matrix 1st Half Year…………………… Page 7
Aspen 1st Half Year Comparisons and Market Details…………… Pages 8-13
Snowmass 1st Half Year Comparisons and Market Details……… Pages 14-17
Residential Vacant Land Sales by Area………………………………Page 18
Tim Estin welcomes your business, inquiries and comments. Email him or call 970.920.7387. Subscribe to The Estin Report and Tim Estin’s Aspen Real Estate Blog.com on twitter @EstinAspen by clicking “Join the conversation” button below or click subscribe button in the menu bar on left:
Disclaimer: The statements made in The Estin Report and on Tim Estin’s blog represent the opinions of the author and should not be relied upon exclusively to make real estate decisions. A potential buyer and/or seller is advised to make an independent investigation of the market and of each property before deciding to purchase or to sell. To the extent the statements made herein report facts or conclusions taken from other sources, the information is believed by the author to be reliable, however, the author makes no guarantee concerning the accuracy of the facts and conclusions reported herein. Information concerning particular real estate opportunities can be requested from Tim Estin at 970.920.7387 or by email. The Estin Report is copyrighted 2011 and all rights reserved. Use is permitted subject to the following attribution: “The Estin Report: State of the Aspen Market, By Tim Estin, mba, gri, www.EstinAspen.com”
________________________________________________________________________
