

Released Oct 8, 2017 v2.1
Sept 2017
Aspen and Snowmass Village
Real Estate Snapshot
(Click link above for full 10 Pg PDF
with detailed charts and tables for Aspen and Snowmass Village
real estate sales and sales by neighborhoods.)
Bottom Line
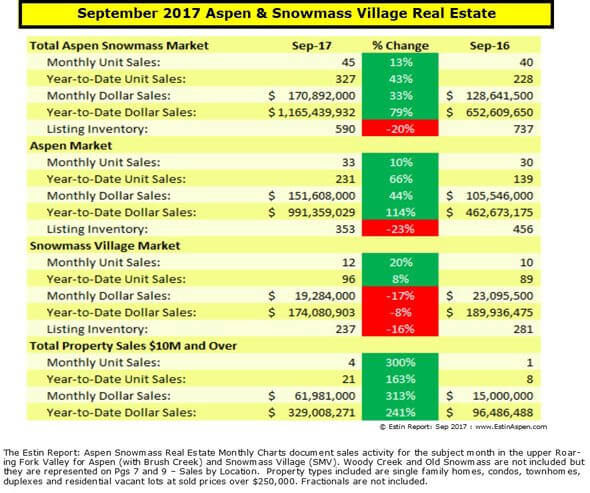
We are on a remarkably similar path to 2015, the biggest year since the Great Recession.
– Through Sep 2017 YTD, total Aspen and SMV combined dollar sales have exceeded Sep 2015 YTD by 4.3%, $1.165B vs $1.117B.
– Unit sales are also similar: (327) in 2017 YTD vs (331) in 2015 YTD.
– And luxury sales of properties over $10M are tracking 2015: there have been (21) in 2017 YTD vs (23) in 2015 YTD.
Listing Inventory for the combined marketplace is down (-18%) to 590 properties for sale in Sept. 2017 vs. (671) in Sept. 2015. For the Aspen market, it’s down -14% to (353) properties from (403) in Sept 2015; for Snowmass Village, it’s down -13% to (237) from (268) in Sept 2015.
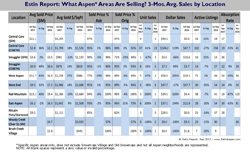
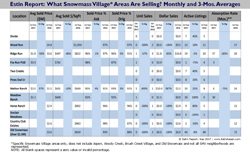
Aspen: Sales by Neighborhoods SMV: Sales by Neighborhood
September 2017 Market Statistics Summary for Aspen Only *
Aspen condo sales September 2017
Unit Sales: +35% (23) in September ‘17 from (17) in September ‘16
Dollar Sales: +84% $67M in September ‘17 from $36M in September ‘16
Inventory Active Listings: -26% (187) in September ‘17 from (138) in September ‘16
Aspen condo sales YTD
Unit Sales: +41% (135) in September ‘17 from (96) in September ‘16
Dollar Sales: +51% $310M in September ‘17 from $205M in September ‘16
Inventory Active Listings: -17% (323) in September ‘17 from (387) in September ‘16
Aspen Single family home sales September 2016
Unit Sales: -38% (8) in September ‘17 from (13) in September ‘16
Dollar Sales: +19% $82M in September ‘17 from $69M in September ‘16
Inventory Active Listings: -15% (170) in September ‘17 from (201) in September ‘16
Aspen Single family home sales YTD
Unit Sales: +137% (83) in September ‘17 from (35) in September ‘16
Dollar Sales: +184% $630M in September ‘17 from $222M in September ‘16
Inventory Active Listings: +1% (298) in September ‘17 from (293) in September ‘16
* Typically, the Aspen market represents 70-75% of the total combined Aspen Snowmass Village real estate marketplace.
Links to September 2017 Aspen and Snowmass Village
Sold Property Photos and Details
Aspen Sep 2017 Closed Properties (31). This link is valid until 11/1/2017.
Snowmass Village Sep 2017 Closed Properties (11). This link is valid until 11/1/2017.
Vacant Lots Sep 2017 Closed Properties (3). This link is valid until 11/1/2017.
Disclaimer: The statements made in The Estin Report and on Aspen broker Tim Estin’s blog represent the opinions of the author and should not be relied upon exclusively to make real estate decisions. A potential buyer and/or seller is advised to make an independent investigation of the market and of each property before deciding to purchase or to sell. To the extent the statements made herein report facts or conclusions taken from other sources, the information is believed by the author to be reliable, however, the author makes no guarantee concerning the accuracy of the facts and conclusions reported herein. Information concerning particular real estate opportunities can be requested from Tim Estin at 970.309.6163 or by email. The Estin Report is copyrighted 2017 and all rights reserved. Use is permitted subject to the following attribution with a live link to this website: “The Estin Report by Aspen broker Tim Estin on Aspen Real Estate.”
