
Estin Report: Historic Pace of Sales Charts
The charts are: the historic pace of dollar and unit sales starting in 2006 (in 10 yr increments) to the present quarter for Aspen and Snowmass Village (SMV) by property types respectively: 1) All property types combined; 2) Single family homes (SFH); 3) Condos/townhomes; 4) Vacant land / lots. Fractionals, with the exception of extreme sales, are not included.
Oct 4, 2019 thru Q3 2019 (Sep 30, 2019)
Aspen: Historic Aspen CO Real Estate Sales through Q32019 (4 pages: total Aspen market dollar and unit sales and by property types: single family homes, condos, vacant land)
Snowmass Village: Historic Snowmass Village CO Real Estate Sales through Q3 2019 (4 pages: total Aspen market dollar and unit sales and by property types: single family homes, condos, vacant land)
Oct 4, 2018 thru Q3 2018 (Jul 1 – Sep 30)
Click chart for full Aspen Qtrly Pace of Sales Chart Series
Aspen Charts by Sales Totals & Property Types Q1 2007 – Q3 2018 PDF
 Click chart for full Snowmass Village Qtrly Pace of Sales Chart Series
Snowmass Village Charts by Sales Totals & Property Types
Q1 2007 – Q3 2018 PDF
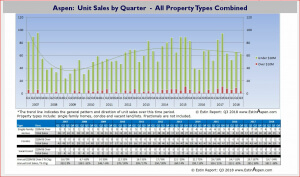
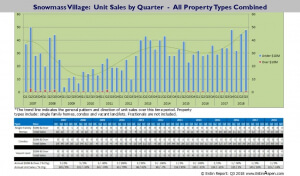
Clients often ask, “Where are we now compared to the Great Recession…?”. These charts answer that question for a visual reference to that conversation – comparing present Aspen and Snowmass Village sales activity to pre-recession mid-2000’s levels with unit and dollar sales history.
The charts are: the historic pace of dollar and unit sales since 2006 for Aspen and Snowmass Village (SMV)
by property types:
1) all property types combined
2) single family homes (sfh)
3) condos/townhomes
4) vacant land / lots.
(Fractionals, with the exception of extreme sales, are not included.)
As the unit sales drop-off in the 2nd Half 2007 so foreshadowed the Great Recession, sales velocity or pace, whether by dollar or unit sales, is useful to consider.
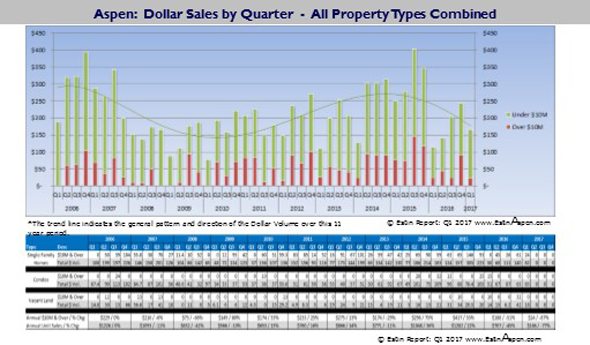
While many real estate professionals use dollar sales as the single metric for sales performance (it often looks ‘better’), unit sales are a more accurate measure of market activity – are sales increasing or decreasing? Dollar sales, on the other hand, can be skewed disproportionately by extreme high or low end sales.
In these charts, the starting point for the trend line is 2006 but where the trend line starts will effect its outcome…If the charts had started at 2009, the trend would be more upwards at present than is shown here.
Charts with earlier start dates:
Starting at Q1 2006-2017
Historic Dollar and Unit Sales charts by Quarter and Property Types
Aspen and Snowmass Village:
Single Family Homes, Condos/Townhomes and Vacant Land / lots
Click these links:
Aspen PDF
Snowmass Village PDF

Disclaimer: The statements made in The Estin Report and on Aspen broker Tim Estin’s blog represent the opinions of the author and should not be relied upon exclusively to make real estate decisions. They do not represent the opinions or statements of Aspen Snowmass Sothebys International Realty. A potential buyer and/or seller is advised to make an independent investigation of the market and of each property before deciding to purchase or to sell. To the extent the statements made herein report facts or conclusions taken from other sources, the information is believed by the author to be reliable, however, the author makes no guarantee concerning the accuracy of the facts and conclusions reported herein. Information concerning particular real estate opportunities can be requested from Tim Estin at 970.309.6163 or by email.
The Estin Report is copyrighted 2017 and all rights reserved. Use is permitted subject to the following attribution with a live link to the source: “The Estin Report on Aspen Real Estate.”
_____________________________________________
