

Released Mon Aug 9, 2019 v2.0…Scroll down to continue reading Bottom Line from home page
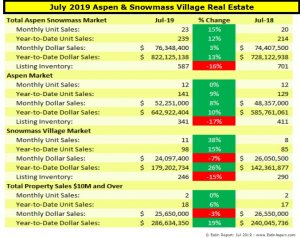
July & YTD 2019 Aspen Snowmass Real Estate Market Summary
Click images to enlarge
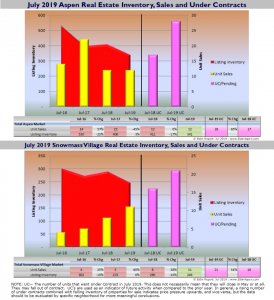
July 2019 Aspen Snowmass Village Real Estate Inventory, Sales and Under Contracts
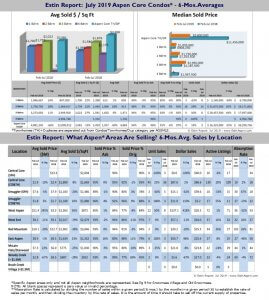
July 2019 Aspen Condo Sales and Sales by Aspen Neighborhoods
Click images to enlarge.
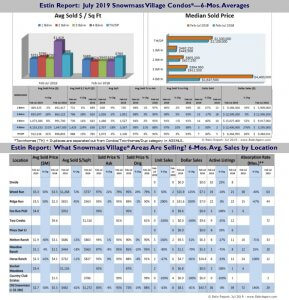
July 2019 Snowmass Condo Sales and Sales by Snowmass Village Neighborhoods
Click download button above right for full July 2019 Snapshot – 10 Pg PDF
Bottom Line Q & A:
Q: Where are we now? Compare early Aug 2019 to same time last year
A: Aspen SMV sales are now at $822MM vs $728MM last year, +13%,..but not ALL areas are experiencing the same robust sales…It’s a bifurcated market: property sales inside the roundabout are generally exceedingly strong – high demand, low supply, a seller’s market; property sales outside the roundabout are more challenging and competitive – long days on market, price resistant sellers, a buyer’s market in most of those areas.
Q: What’s happening with Aspen sales?
A: Aspen dollar sales are up +10% over same time last year…And in unit sales, up +9%. Inventory – active properties for sale – are down -17% over last year…and that’s an issue with buyers, not enough great selections at $MM dollars gets discouraging.
Q: And how about Snowmass Village sales?
A: SMV dollar sales are up 15% and up 26% in unit sales…Snowmass sells many more condos at 1/3 the price of Aspen condos in general, so their unit sales numbers are high.
Q: Where are we headed…?
A: Under contracts are a really good future indicator because typically closings will occur within 30 days after going under contract. So for example, in July 2019 in Aspen, there were (28) UC’s vs last July 18 (17), up a huge +65%…it tells us we’re going to have a very strong end of summer, August, as most of those under contracts are likely to close. In SMV, the number of UC’s is +31%, (21) this July vs (16) last July.
Q: How do Aspen and Snowmass Village compare price-wise…What’s the avg. cost of an Aspen condo?
A: In July the avg 2-Bdrm Aspen condo cost $1.76M/$1,750 sq ft for a 900-1,000 sq ft unit.
Q: Of a Snowmass Village condo?
A: SMV 2 bdrm condo was $1M/$730 sq ft, or 58% less than Aspen.
Q: Where are the great values? If you are looking for “deals” and better value – go to Snowmass Village, 8 miles from Aspen, where generally the discount is 50% or more to Aspen prices vs an historical 25-30%; look at the McLain Flats and Starwood area, Woody Creek and Old Snowmass (see Pg 7 “What Aspen Areas are Selling?”, P9 9 for Snowmass, and see the discounts $/sq ft)
July 2019 Market Statistics Summary for Aspen Only *
Aspen condo sales July 2019
- Unit Sales: 0% (7) in Jul ‘19 from (7) in Jul ‘18
- Dollar Sales: +12% $12M in Jul ‘19 from $11M in Jul ‘18
- Inventory Active Listings: -25% (117) in Jul ‘19 from (156) in Jul ‘18
Aspen condo sales YTD
- Unit Sales: +10% (80) in Jul ‘19 from (73) in Jul ‘18
- Dollar Sales: -17% $176M in Jul ‘19 from $212M in Jul ‘18
- Inventory Active Listings: -8% (223) in Jul ‘19 from (243) in Jul ‘18
Aspen Single family home sales July 2019
- Unit Sales: -60% (2) in Jul ‘19 from (5) in Jul ‘18
- Dollar Sales: -31% $26M in Jul ‘19 from $37M in Jul ‘18
- Inventory Active Listings: -9% (178) in Jul ‘19 from (195) in Jul ‘18
Aspen Single family home sales YTD
- Unit Sales: -16% (42) in Jul ‘19 from (50) in Jul ‘18
- Dollar Sales: +10% $375M in Jul ‘19 from $342M in Jul ‘18
- Inventory Active Listings: -10% (248) in Jul ‘19 from (277) in Jul ‘18
* Typically, the Aspen market represents 70-75% of the total combined Aspen Snowmass Village real estate marketplace.
NOTE: Excluded as from July 2019 market snapshot data as Aspen outlier sales: 4 mobile home sales characterized as Aspen single family home sales in the MLS and a Gateway to Snowmass sale under $1.5M – MLS #’s 155875, 157020, 158641, 157992,157792.
July 2019 Market Statistics Summary for Snowmass Village Only
Snowmass Village condo sales July 2019
- Unit Sales: 0% (4) in Jul ‘19 from (4) in Jul ‘18
- Dollar Sales: -33% $3M in Jul ‘19 from $5M in Jul ‘18
- Inventory Active Listings: -12% (159) in Jul ‘19 from (181) in Jul ‘18
Snowmass Village condo sales YTD
- Unit Sales: +21% (69) in Jul ‘19 from (57) in Jul ‘18
- Dollar Sales: +51% $72M in Jul ‘19 from $48M in Jul ‘18
- Inventory Active Listings: -3% (279) in Jul ‘19 from (290) in Jul ‘18
Snowmass Village Single family home sales July 2019
- Unit Sales: +250% (7) in Jul ‘19 from (2) in Jul ‘18
- Dollar Sales: +310% $21M in Jul ‘19 from $5M in Jul ‘18
- Inventory Active Listings: -21% (75) in Jul ‘19 from (95) in Jul ‘18
Snowmass Village Single family home sales YTD
- Unit Sales: +4% (27) in Jul ‘19 from (26) in Jul ‘18
- Dollar Sales: +34% $105M in Jul ‘19 from $79M in Jul ‘18
- Inventory Active Listings: -3% (131) in Jul ‘19 from (136) in Jul ‘18
* Typically, the Snowmass Village market represents 25-30% of the total combined Aspen Snowmass Village real estate marketplace.
NOTE: Excluded from July 2019 market snapshot data as Snowmass Village outlier sales: Two SMV condo sales were considered outliers and not included in the Snapshot data: 152205 Assay Hill Lodge at 130 Wood Rd closed at $1.35M/$1,300 sq ft and 152248 Base Village/Limelight at 65 Wood Rd closed at $2.025M/$1,465 sq ft.
Links to July 2019 Aspen and Snowmass Village Sold Property Photos and Details
Aspen July 2019 Closed Properties (9). This link is valid until 8/28/2019.
Snowmass Village July 2019 Closed Properties (11). This link is valid until 8/28/2019
Vacant Lots July 19 Closed Properties (2). This link is valid until 8/28/2019.
___________________
