

Released 11.05.18 v1.5
Click images above to enlarge
Notes on significant sales Oct 2018:
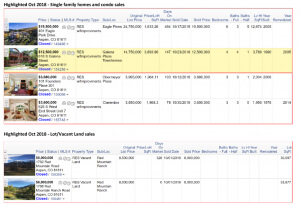
Single family Home sales
> 149486 = $19.5M/$1539 sq ft…highest price sale in Oct and highest price per sq ft
Condo sales
> 154258 Galena Place Townhome located almost Aspen Mountainside next to Residences at the Little Nell – superb location in town steps to Gondola
> 155748 Clarendon needing updating sold at 3.6M/$1,840 sq ft
Vacant lot/ Land sales
> 2 vacant lots high atop Red Mountain and a 6,000 sq ft West End lot 2 blocks from Aspen Core with approvals and plans in place
Bottom Line
Much of the the time, these monthly analyses are just too close together and finding a focus point is a fool’s errand…
With that said, here goes: Oct sales were solidly good – Aspen all property unit sales were up 19% and Snowmass up 24%.
For the year, both market areas are down -24% in unit sales over last year. Unit sales are typically the best measure of market direction. Additionally, Aspen and Snowmass dollar sales are down -22% and -11% respectively for the year.
But Snowmass sales have continued to gain traction over Aspen, particularly this summer… Why? SMV is selling at 40-60% discount to Aspen versus the historical 25-30% spread. Why the discrepancy? SMV suffered mightily during the recession and has been clawing its way back for the past 2-3 years. Momentum now is on Snowmass’ side … All eyes are on the resort as it celebrates its 50th Anniversary on Dec 15th with the Base Village Phase II completion and certainly, a re-awakening. Yodel from the Mountains: “Seize the day SMV!”
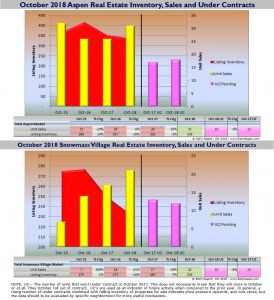
Inventory of Aspen condos is very low, and that may explain why unit sales are off, -28% for the year – either that and/or prices are too high, or a combination of the two. Vacant land experienced a surge of (6) sales in Oct compared to (0) same time last year. Developers may be lining up for the next wave of new residential construction projects to be completed in about 3 years.
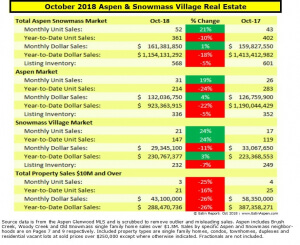
October 2018 Market Statistics Summary for Aspen Only*
Aspen condo sales October 2018
- Unit Sales: -14% (12) in October ‘18 from (14) in October ‘17
- Dollar Sales: +10% $36M in October ‘18 from $33M in October ‘17
- Inventory Active Listings: 0% (133) in October ‘18 from (133) in October ‘17
Aspen condo sales YTD
- Unit Sales: -28% (107) in October ‘18 from (149) in October ‘17
- Dollar Sales: -12% $301M in October ‘18 from $343M in October ‘17
- Inventory Active Listings: -19% (277) in October ‘18 from (343) in October ‘17
Aspen Single family home sales October 2018
- Unit Sales: +8% (13) in October ‘18 from (12) in October ‘17
- Dollar Sales: -28% $67M in October ‘18 from $94M in October ‘17
- Inventory Active Listings: -2% (163) in October ‘18 from (166) in October ‘17
Aspen Single family home sales YTD
- Unit Sales: -11% (85) in October ‘18 from (96) in October ‘17
- Dollar Sales: -27% $532M in October ‘18 from $732M in October ‘17
- Inventory Active Listings: -7% (294) in October ‘18 from (319) in October ‘17
* Typically, the Aspen market represents 70-75% of the total combined Aspen Snowmass Village real estate marketplace.
October 2018 Market Statistics Summary for Snowmass Village Only
Snowmass Village condo sales October 2018
- Unit Sales: +45% (16) in October ‘18 from (11) in October ‘17
- Dollar Sales: +6% $13M in October ‘18 from $12M in October ‘17
- Inventory Active Listings: -3% (145) in October ‘18 from (149) in October ‘17
Snowmass Village condo sales YTD
- Unit Sales: +34% (103) in October ‘18 from (77) in October ‘17
- Dollar Sales: +3% $84M in October ‘18 from $82M in October ‘17
- Inventory Active Listings: +15% (327) in October ‘18 from (282) in October ‘17
Snowmass Village Single family home sales October 2018
- Unit Sales: -17% (5) in October ‘18 from (6) in October ‘17
- Dollar Sales: -22% $16M in October ‘18 from $21M in October ‘17
- Inventory Active Listings: -13% (74) in October ‘18 from (85) in October ‘17
Snowmass Village Single family home sales YTD
- Unit Sales: +39% (39) in October ‘18 from (32) in October ‘17
- Dollar Sales: +16% $127M in October ‘18 from $110M in October ‘17
- Inventory Active Listings: +2% (146) in October ‘18 from (143) in October ‘17
Links to October 2018 Aspen and Snowmass Village Sold Property Photos and Details
Aspen Oct 2018 Closed Properties (25). This link is valid until 11/30/2018.
Snowmass Village Oct 2018 Closed Properties (21). This link is valid until 11/30/2018.
Vacant Lots October 2018 Closed Properties (6). This link is valid until 11/30/2018.
