
Released Dec 6, 2017 v2.0 Nov 2017 Aspen and Snowmass Village Real Estate Snapshot (Click images above for full 10 Pg Snapshot PDF with detailed charts and tables for Aspen… Read More
Released Dec 6, 2017 v2.0 Nov 2017 Aspen and Snowmass Village Real Estate Snapshot (Click images above for full 10 Pg Snapshot PDF with detailed charts and tables for Aspen… Read More
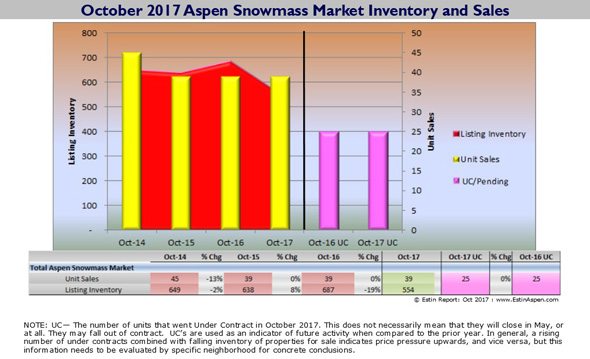
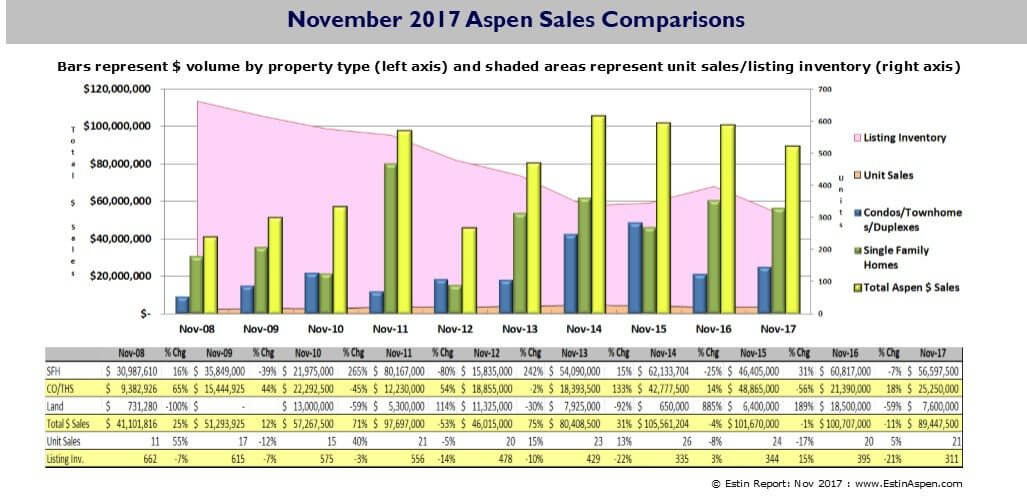
For 2017 YTD thru Oct, the total combined Aspen Snowmass dollar market is nearing the 2015 YTD mark, $1.23B versus $1.38B; in unit sales, it is 349 sales vs 341 respectively. Overall inventory of available properties for sale in Oct 2017 has declined 13% since Oct 2015. For Aspen condos specifically - a particularly hot segment of the market, it has declined 17% in the same period. Read More

Released Oct 8, 2017 v2.1 Sept 2017 Aspen and Snowmass Village Real Estate Snapshot… Read More
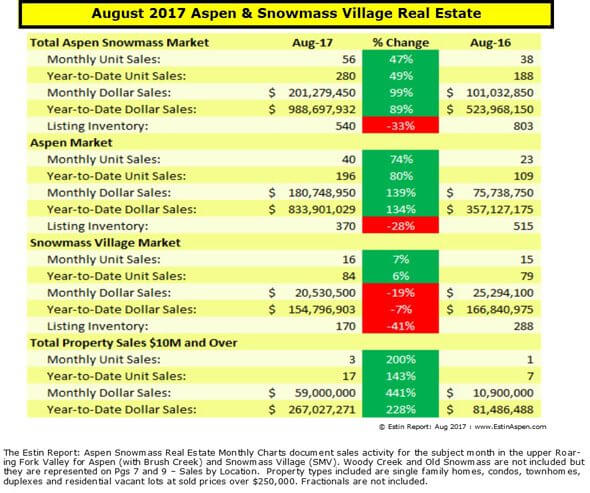
Released Sep 15, 2017 v2.2 August 2017 Aspen and Snowmass Village Real Estate Snapshot (Click link above for full 10 Pg PDF… Read More
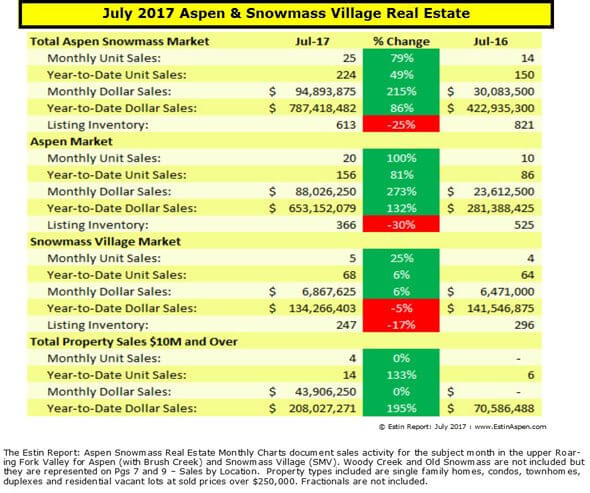
Released Mon Aug 8, 2017 v2 July 2017 Aspen and Snowmass Village Real Estate Snapshot (Click link above for full 10 Pg PDF… Read More
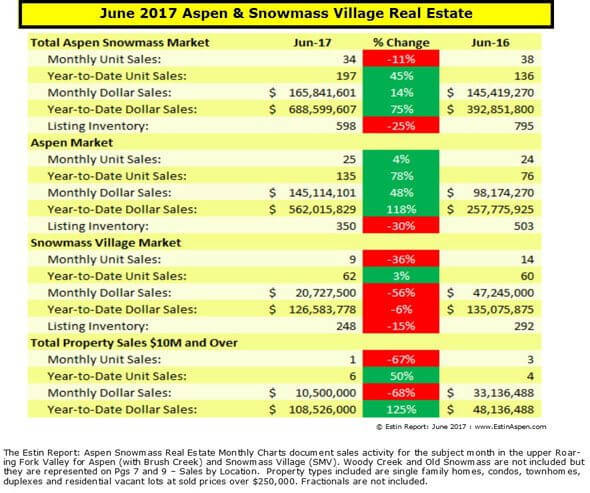
Released Mon July 10, 2017 v2.0 June 2017Aspen and Snowmass VillageReal Estate Snapshot(Click table or link above for full 10 Pg PDF with detailed charts and tables for Aspen and Snowmass Village sales and sales by neighborhoods.) Bottom Line June 2017 has been the best June for Aspen real estate in the past 10 years. Dollar sales for properties selling over $10M are up over 125% year-to-date (YTD) and for all properties, sales are up 118% YTD. At the same time, inventory of available properties for sale is declining, down 30% in June ’17 year over year, which should create upward pressure on prices. Read More
Released June 4, 2016 v1.5
May 2017
Aspen and Snowmass Village
Real Estate Snapshot
Click link for 10-Pg PDF
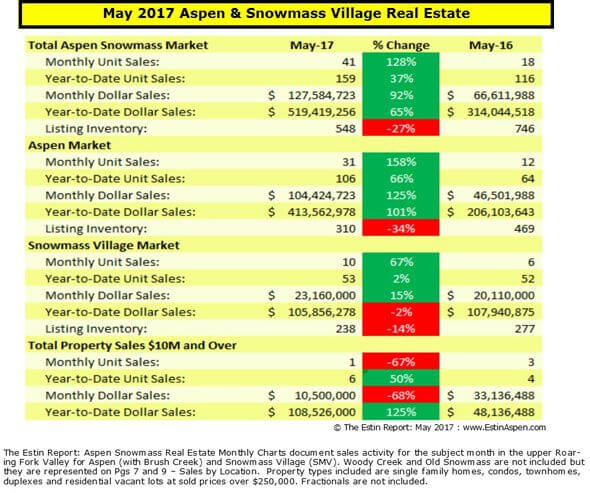
Bottom Line
There is a night and day difference between May 2017 and same time last year. The market appears to be firing on all cylinders heading into the summer selling season.
A statistic that says it all: there were (15) Aspen single family home sales in May 2017 versus (2) in May 2016, +650% (Pg 6). Read More
Released 06/07/17 v4.1 Executive summary and full report as PDF. The 32-page report is also available in a print edition at downtown Aspen kiosks (Information Center opposite Paradise Bakery), at Sothebys offices at 415 E. Hyman in the middle of the Aspen Mall, 300 Spring St opposite the Aspen Art Museum and at the Pitkin County Airport magazine kiosk in the luggage area.
Click for full report PDF
Executive Summary
Aspen real estate is in turn-a-round mode from a dismal 2016 when global uncertainty curtailed buyers' appetite for luxury high end second home purchases. Post-election 2016 through Q117, an upper-end Aspen real estate recovery is in full bloom.
Sales over $10M
For 2017 YTD through April 30th, there were 5 property sales over $10M versus 1 sale over $10M during the same period in 2016 - a Monarch on the Park PH condo that sold at $15M/$4,276 sq ft on 2/5/16. Of these 5 sales, (2) were over $20M ea. at an avg. $2,431 sq ft; (3) were between $10-20M at an avg. $2,056 sq ft. If the property is in town and priced over $10M, it should sell above $2,000 sq ft; if out of town, there's approximately a 15-30% discount for these luxury properties.
Stats: 2017 YTD (Jan 1 - April 30, 2017)
Aspen Single family home sales thru Apr YTD
Unit Sales: +127% (25) thru April ‘17 from (11) thru April ’16
Dollar Sales: +239% $192M thru April ‘17 from $57M thru April ‘16
Aspen condo sales thru Apr YTD
Unit Sales: +13% (43) thru April ‘17 from (38) thru April ‘16
Dollar Sales: +11% $94M thru April ‘17 from $84M thru April ‘16
SMV Single family home sales thru Apr YTD
Unit Sales: -8% (11) thru April ‘17 from (12) thru April ‘16
Dollar Sales: -17% $41M thru April ‘17 from $50M thru April ‘16
SMV condo sales thru Apr YTD
Unit Sales: -6% (29) thru April ‘17 from (31) thru April ‘16
Dollar Sales: -5% $29M thru April ‘17 from $31M thru April ‘16
But not everyone is happy. Reasons: 1) Although Snowmass Village, representing 20-30% of our total combined market at any given time, survived 2016 relatively unscathed - its sales were fairly even with the prior year and it suffered significantly less in 2016 than Aspen - the resort was down mildly in Q117; 2) The surging Aspen market activity grabbing local head-lines these days is very specific: location specific, property specific, style/design specific, property age specific...and then, there’s inside the roundabout (good) and there’s outside (ho-hum). Not all are celebrating.
If one is prepared to pay premium prices and pour money into prescient developer’s pockets who saw the lack of new-built product 2-4 years ago and strategized the redevelopment of prime-located residential properties coming to fruition now, seek out this concentration of in-town, new-built product. Justifiably so.
If one is looking for motivated sellers and good-to-great values in stunningly beautiful settings just 5-15 minutes beyond downtown Aspen, play the contrarian hand and re-discover and embrace the areas and neighborhoods so favored by prior famous and not-so-famous Aspen settlers.
What’s Trending Read More
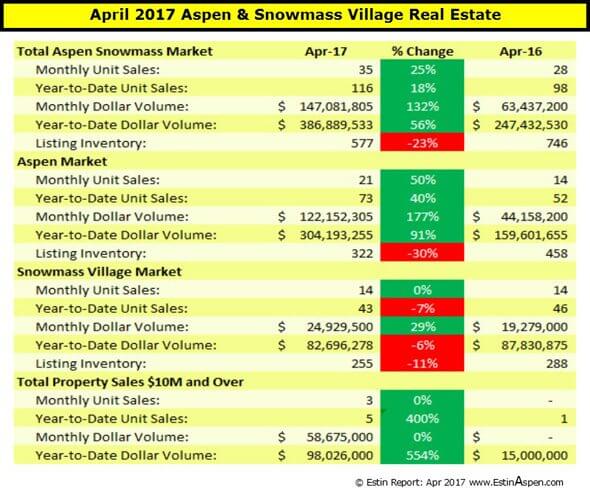
Released Wed. May 3, 2017 v2.21 April 2017 Aspen and SnowmassReal Estate Snapshot(Click link above for full 10 Pg PDF withdetailed charts and tables for Aspen and Snowmass Village) Bottom LineAspen real estate is in turn-a-round mode from a dismal 2016 when global uncertainty curtailed buyers' appetite for luxury high end 2nd home purchases. Post-election 2016, an upper-end Aspen real estate recovery is in full bloom.In April 2017, for the combined Aspen/Snowmass Village market, the number of units sold is up +25%, from 28 last year to 35 this year. The number of properties that went under contract in April 2017 was up +20%, 25 last year to 30 this year. Under contracts are viewed as an indicator of future activity. But the surging market activity grabbing local headlines is very specific: location specific, property specific, style/design specific, property age specific... There’s inside the roundabout and there’s outside.Not everyone’s partying at present. Read More
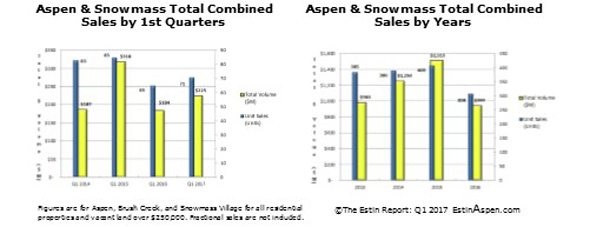
Released Apr 3, 2017 v2.0 Bottom LineMar 2017 Snapshot(End of 1st Quarter 2017: Jan 1 - Mar 31) Excerpt: Click tables to enlarge Mar 2017 Aspen and SnowmassReal Estate Snapshot (Click Table above for full 10 Pg PDF withdetailed charts and tables for Aspen and Snowmass Village) For year-to-date (YTD), Jan 1 through Mar 31, 2017, the total combined Aspen Snowmass Village market is up 22% in dollar sales to $224M from $184M same time last year and up 11% in unit sales with (78) sales in 2017 versus (70) last year-to-date. The number of under contract properties for the combined Aspen Snowmass Village market is up 121% to (35) in Mar 2017 versus (24) same time last year.Under Contracts are used as an indicator of future activity when compared to the prior year. Read More
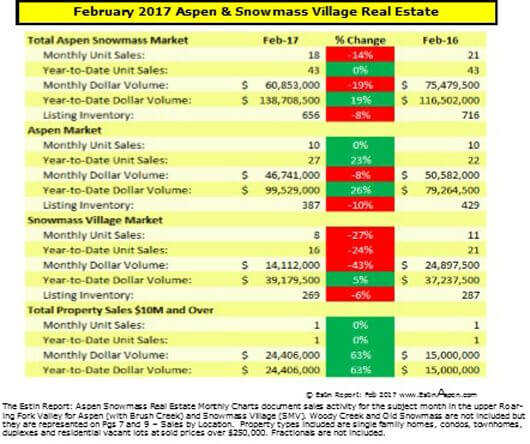
Released 03/06/16 v2.0 Feb 2017 Aspen and SnowmassReal Estate Snapshot (Click Table above for full 10 Pg PDF with detailed charts and tables) Bottom Line Total Aspen Snowmass Village Real Estate sCombined For year-to-date (YTD), Jan 1 through Feb 28, 2017, the total combined Aspen Snowmass Village real estate market is up 19% in dollar sales to $139M from $117M same time last year and no change in unit sales with (43) in 2017 versus (43) last year. The number of under contract properties for the combined Aspen Snowmass Village market is up 52% to (35) in Feb 2017 versus (23) same time last year. Under Contracts are used as an indicator of future activity when compared to the prior year. Read More
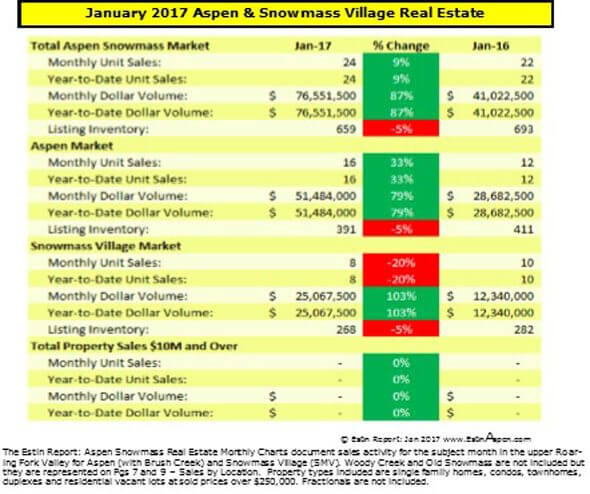
Released Feb.10, 2017 v2.2 Jan 2017 Aspen and Snowmass VillageReal Estate Snapshot(Click Table above for full 10 Pg PDF with detailed charts and tables) Bottom Line The Jan 2017 Aspen real estate market* is up 33% in unit sales and 117% in dollar volume over Jan 2016. But in Jan ‘16, the stock market was plummeting and the local real estate market went deep south. The year-to-year comparison is from a low base last year.Current sales are approximately 50% better than Jan 2016 and 50% less than a sizzling Jan 2015. Performance-wise we’re in the middle of the past two years .Post Nov.‘16 election sales finally started picking up relative to the dismal 1st Half of 2016 that was caused by paralyzing political uncertainty. Sales continue to be on the rise now. Of particular note, in Jan 2017 the number of under contracts (UC's)/Pendings exceeded Jan 2016 by 142%, (29) now versus (12) then. UC's - properties that are have gone under contract but not yet (and may not ) closed - are viewed as an indicator of future activity. *In Jan 2017, Aspen unit and dollar sales represent 67% of total Aspen and SMV combined sales.Typically, they are closer to 70-80% of the total combined sales. Read More
Thank you for your interest
For the most current Estin Reports on the Aspen Snowmass Real Estate Market
- Monthly, annual, in-between and special reports -
Call 970-309-6163.anytime to discuss specific properties and/or the market.
Your information will never be shared.
