

Released Jan 3, 2019 v1.75 on or near the 1st Monday of each month. The Snapshot is a 10-Page summary of Aspen and Snowmass Village sales activity for the subject month and includes year-to-date data. On Jan 3rd, the following revision v1.75 was made: “For 2018, Snowmass Base Village sales accounted for 30% of all Snowmass’s condo/townhome sales. (According to Snowmass Base Village broker associate Steve Harriage, there were 47 closed and 4 pending for 2018 in Assay Hill Lodge, Base Village-Limelight and Base Village-Lumin. Of those, 6 were resales. There were 155 total condo/townhome/duplex sales in 2018 in Snowmass Village.)”
Click images to enlarge


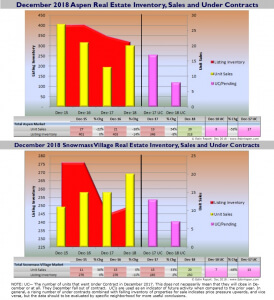
Aspen real estate sales since 2009 Snowmass Village sales since 2009
Click images to enlarge
Click images to enlarge
Click images to enlarge
Bottom Line
For the total combined Aspen Snowmass marketplace, 2018 was the 3rd best year of the past seven since 2012 in terms of dollar sales volume and unit sales 2017 ranks as #1 followed by 2015 and then 2018.
Specifically, 2018 dollar sales are off 18% and unit sales are down 7% from 2017. Unit sales are a better indicator of market activity because they are not skewed by extreme high or low priced sales. For an indices comparison, according to Marketwatch, for the year 2018 vs 2017, the S&P 500 fell 6.2%, the Dow dropped 5.6% and the Nasdaq Composite shed 3.9%, marking the worst annual performance for all three since 2008.
For the individual Aspen and Snowmass Village markets:
ASPEN
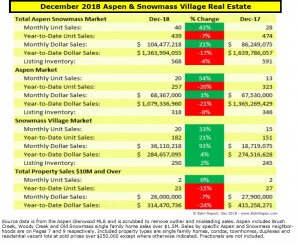
> 2018 Aspen dollar sales are down 21% to $1.079B from $1.365B and 2018 units sales are down 20% to 257 from 323.
> 2018 Aspen inventory, the number of properties for sale is down 8% to 318 units for sale from 346 last year.
>For a breakdown of sales by property types – single family homes, condos and vacant land, see page 6 of the Dec ’18 snapshot.
Of particular note:
– Aspen condos/townhomes/duplex 2018 dollar sales are down 5% to $372M from $392M and unit sales are down 17% to 138 from 167.
– Aspen vacant lots/land sales fell significantly from $135M in 2017 to $115M in 2018, down 15%, and unit sales fell from 44 in 2017 to 24 in 2018, down 45%. Most of those lots sold in 2017 have new homes being built.
– Aspen single family home 2018 dollar sales are down 29% to $592M from $838M in 2017 and unit sales are down 15% to 95 from 112 in 2017.
SNOWMASS VILLAGE
> Snowmass Village 2018 dollar sales for the year are up 4% to $285M from $276M and 2018 units sales are up 21% to 182 from 151.
> Snowmass Village listing inventory, the number of properties for sale, is up 2% to 250 units for sale from 245 last year.
>For a breakdown of sales by property types – single family homes, condos and vacant land, see page 8 of the snapshot.
Of particular note:
– Snowmass Village condos/townhomes/duplex 2018 dollar sales are up 37% to $131M from $95M and unit sales are up a huge 40% to 134 sales from 96 last year. Much of this increase has to do with: SMV 50th Anniversary Celebration Dec 15, 2018; the excitement surrounding the very visible transformation and build-out of the Snowmass Base Village; New Base Village condo product coming on line and a number of these closing at year end in Dec 2018. For 2018, Snowmass Base Village sales accounted for 30% of all Snowmass’s condo/townhome sales. (According to Snowmass Base Village broker associate Steve Harriage, there were 47 closed and 4 pending for 2018 in Assay Hill Lodge, Base Village-Limelight and Base Village-Lumin. Of those, 6 were resales. There were 155 total condo/townhome/duplex sales in 2018 in Snowmass Village.)
– Snowmass Village vacant lots/land sales fell significantly from $37.25M in 2017 to $19.5M in 2018, down 48%, and unit sales fell from 12 in 2017 to 5 in 2018, down 58%.
– Snowmass Village single family home sales in 2018 were about even with 2017 sales.
Where are we and where are we going?
Typically as the stock market goes, so goes Aspen real estate. According to the WSJ in early Jan 2019,
“Although most investors agree the U.S. economy will likely continue to expand in 2019, the broader backdrop for the stock market has darkened in recent months in the face of a Federal Reserve intent on unwinding its easy-money policies, a continuing trade dispute between Washington and Beijing, weakening corporate profit growth and a partial government shutdown…Most analysts say the damage could worsen if economic growth truly weakens. The S&P 500 has risen more than 250% since it started its bull run in March 2009, and additional trade tariffs or hawkish pronouncements from the Fed, among other matters, could encourage more investors to sell stocks to protect their gains.”
I remain cautiously optimistic, a term much over used, with this caveat. There is plenty of Aspen developer inventory remaining in the active listing pipeline that is aggressively and optimistically priced. It is priced accordingly due to limited inventory within their respective property category. New or new-built product continues to command premium pricing and there are solid comparables to justify the high prices. But certainly, some wishful thinking exists within these listings.
Still, discounting is taking place from ask prices and if the financial markets continue in their volatile and uncertain state, there will be more discounting and price decreases. Pessimism, or the seeming inevitability of a downturn, will eventually, if not already, put a drag on market. This will ripple outward geographically and downwards price-wise affecting the rest of the market.
But there is a contrarian view that holds that if so many expect a downturn, caution is already built into their investment decisions and that will extend this long positive financial market run even further.
The better values and more realistic prices – and opportunities to create value – are attainable in non-remodeled properties and those outside the Castle Creek Bridge entry into Aspen. Snowmass Village, a mere 8 miles from downtown Aspen, is particularly noteworthy as values are generally 40-50% less than Aspen prices. Further out, in Woody Creek and Old Snowmass, continued ‘relative’ values abound.
But if one is looking for liquidity and the greatest potential market appreciation, the Aspen Core (downtown) is #1, followed by the historic West End – particularly blocks West 100-300, and Red Mountain characterized by larger lots, larger homes and amazing 180 degrees 4-mountain views, views of town and Aspen’s many fireworks celebrations.
Dec 2018 Market Statistics Summary for Aspen and for Snowmass Village
Aspen Only* December 2018
Aspen condo sales December 2018
- Unit Sales: +129% (16) in December ‘18 from (7) in December ‘17
- Dollar Sales: +103% $48M in December ‘18 from $24M in December ‘17
- Inventory Active Listings: +9% (135) in December ‘18 from (124) in December ‘17
Aspen condo sales YTD
- Unit Sales: -17% (138) in December ‘18 from (167) in December ‘17
- Dollar Sales: -5% $372M in December ‘18 from $392M in December ‘17
- Inventory Active Listings: -10% (325) in December ‘18 from (364) in December ‘17
Aspen Single family home sales December 2018
- Unit Sales: -75% (1) in December ‘18 from (4) in December ‘17
- Dollar Sales: -84% $6M in December ‘18 from $39M in December ‘17
- Inventory Active Listings: -9% (151) in December ‘18 from (166) in December ‘17
Aspen Single family home sales YTD
- Unit Sales: -15% (95) in December ‘18 from (112) in December ‘17
- Dollar Sales: -29% $592M in December ‘18 from $838M in December ‘17
- Inventory Active Listings: -6% (320) in December ‘18 from (344) in December ‘17
* Typically, the Aspen market represents 70-75% of the total combined Aspen Snowmass Village real estate marketplace.
Snowmass Village Only December 2018
Snowmass Village condo sales December 2018
- Unit Sales: +80% (18) in December ‘18 from (10) in December ‘17
- Dollar Sales: +298% $32M in December ‘18 from $8M in December ‘17
- Inventory Active Listings: +3% (154) in December ‘18 from (149) in December ‘17
Snowmass Village condo sales YTD
- Unit Sales: +40% (134) in December ‘18 from (96) in December ‘17
- Dollar Sales: +37% $131M in December ‘18 from $95M in December ‘17
- Inventory Active Listings: +16% (372) in December ‘18 from (320) in December ‘17
Snowmass Village Single family home sales December 2018
- Unit Sales: -60% (2) in December ‘18 from (5) in December ‘17
- Dollar Sales: -61% $4M in December ‘18 from $11M in December ‘17
- Inventory Active Listings: +1% (82) in December ‘18 from (81) in December ‘17
Snowmass Village Single family home sales YTD
- Unit Sales: +0% (43) in December ‘18 from (43) in December ‘17
- Dollar Sales: -5% $134M in December ‘18 from $142M in December ‘17
- Inventory Active Listings: +5% (162) in December ‘18 from (153) in December ‘17
* Typically, the Snowmass Village market represents 25-30% of the total combined Aspen Snowmass Village real estate marketplace.
Links to Dec 2018 Aspen and Snowmass Village Sold Property Photos and Details
Aspen Dec 2018 Closed Properties (17). This link is valid until 1/30/2019.
Snowmass Village Dec 2018 Closed Properties (20). This link is valid until 1/30/2019
Vacant Lots Dec 2018 Closed Properties (3). This link is valid until 1/30/2019.
